Run SQL queries directly on your spreadsheet to pull any data from Demand Sage. Most of our customers leverage this method to build pivot tables and charts on top of these data. Data will update automatically so you don't have to keep doing this manually for your daily, weekly or monthly reports.
We have created a Google Function or formula, just like =sum(A1:A10) or =average(A1:A10) that will allow you and your team to pull the data with a formula directly on the spreadsheet. This function is called =sage() and takes 5 parameters:
Your Hubspot data is stored in a database with a specific schema (columns and tables) corresponding to the entities we are getting from Hubspot. In order to get your table and column names, go to this spreadsheet and copy the tab (schemas) to a spreadsheet where you have the Demand Sage plugin installed:
Note: This specific spreadsheet is empty and the data will only appear once you have copied this over to a working spreadsheet with Demand Sage installed.
Data Source (text) - refers to the data source you want to run the query for. Currently we only support "hubspot" as a value, but we are working on adding more sources in the near future.
Tell us what sources you'd like us to add 👉Tell us now!
Number of Rows (numeric) - Number of rows that your query will return. If you don't know this value, just put a very high value to make sure that you have some buffer. To make sure your query renders, you need to make sure that whatever number you put here must be higher than the number of available rows to the bottom of that specific tab. For example if you are running the query in say A10, your sheet has a total 100 rows, and your number of rows is 100, you will be missing an additional 11 rows to be able to run the query in A10.
Number of Columns (numeric) - The number of columns that your query will return. This should be as easy as matching the columns in your select statement. However, if you are running a select * make sure you check the schema. and have enough columns in your spreadsheet for the query to render. Just like the number of rows, the number of columns has to be equal or higher than the actual number of the query.
SQL query (text)- Our database specifically runs PostgreSQL which allows you to run standard SQL queries against your data. The query needs to be encapsulated in double quotes and can also contain parameters that you can reference from other cells (see the examples section below).
Today() [optional] (Google Sheet Formula) - This parameter will tell Demand Sage to update the queries once a day, so that the data is updated every time you launch the sheet. If you don't include it the query will render and the data won't be updated until you re-run the query in the specific cell.
Run your first query
Here is an example of a query that counts your Hubspot contacts and groups them by source:
Request a List of Deals with Metadata
Using Dynamic Dates with Cell References
You can reference any cells within your query so that you can change your reports without editing the query and leverage capabilities like drop-down menus from Google Sheets and combine them with Demand Sage to generate powerful dynamic reports. In the example below, the query takes in the cell C4 as a parameter. You need to concatenate the cell value using & and the function text() from Google Sheets to include it in the query.
That reference would need to come from the cell C4 from the same spreadsheet you are running =sage:
Querying Different Pipelines with a Dropdown Menu
An of the important entities in Hubspot is the Pipeline. Demand Sage stores all deals from all pipelines in one table and hence you need to tell Demand Sage specifically if you want to retrieve only deals from one pipeline. To easily change pipelines without changing the query you can also leverage Google Sheets' dynamic drop-downs.
First, select the cell where you want your dropdown. Then navigate to Data > Data validation:
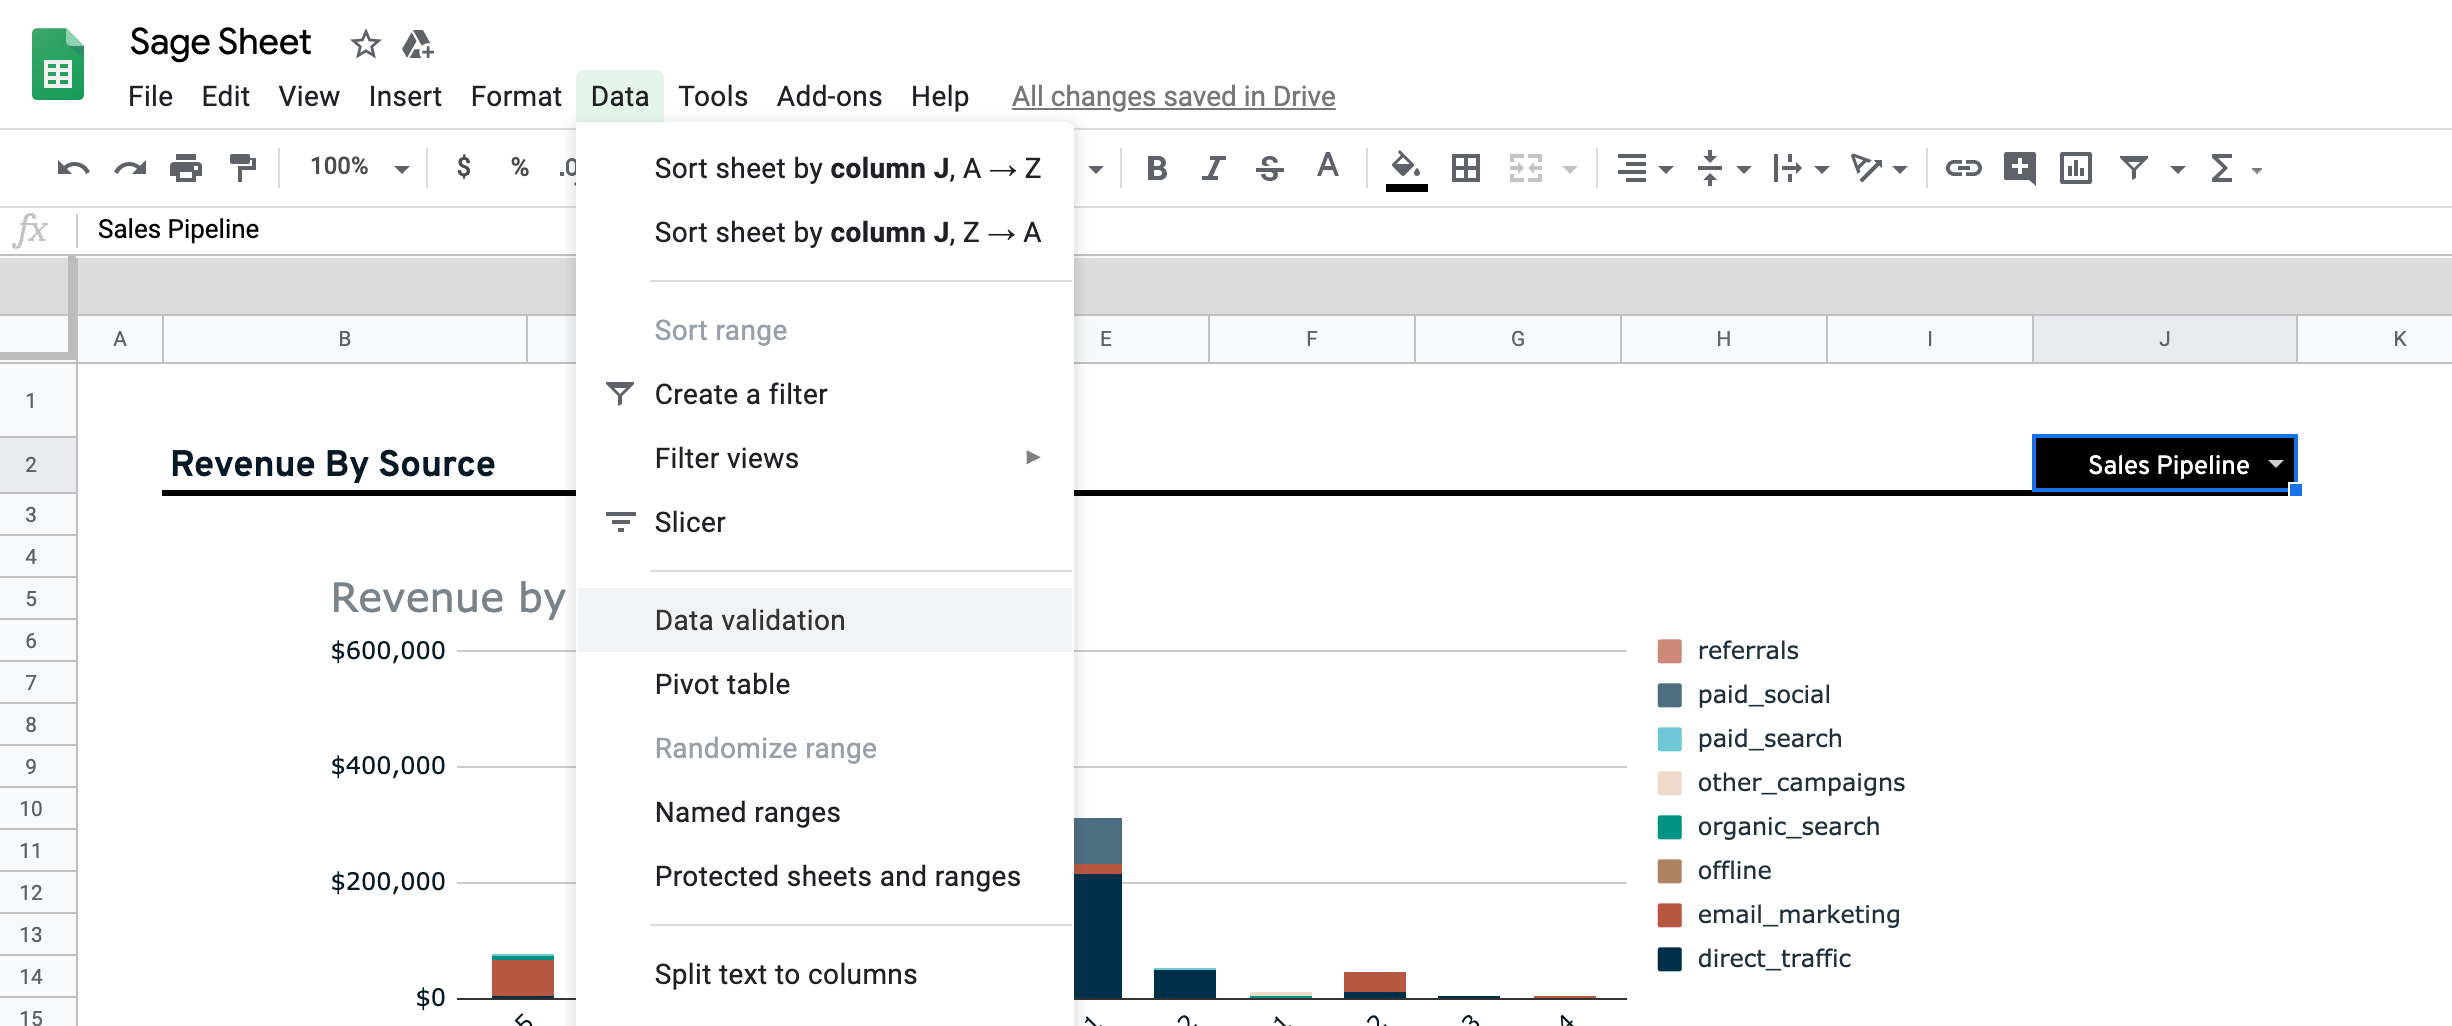
Select "List of items" in the dropdown option and list the exact name of your Hubspot pipelines, separated by a comma. This will generate the dropdown in the cell that you had originally selected.
2. Link to Query
Just like in the example with dates, you need to dynamically reference the cell in your =sage() command, so that every time that you change the value of the cell, Demand Sage queries the corresponding pipeline:
NOTE: You need to join the pipelines table with the deals to table to be able to do this.
The common problems we see are:
Other questions? Happy to help!