
Cloudflare is the largest managed DNS service provider, providing security, performance, and traffic routing for more than 25 million websites. In 2026, Cloudflare serves more than 20% of all global Internet request traffic, protects over 41 million websites, and is the largest managed DNS service in the world.
On November 18, 2025, Cloudflare experienced a major outage lasting nearly 6 hours, which impacted major services like ChatGPT and Spotify .
This article presents the latest Cloudflare statistics, including traffic share, website usage, outage history, paying customers, revenue, regional performance, enterprise customer growth, and employee data.
Top Cloudflare Statistics for 2026
- Cloudflare is used by 20.4% of all websites.
- On December 5, 2025, outage impacted approximately 28% of all HTTP traffic served by their network.
- Currently, 41,880,982 websites use Cloudflare, of which 39,485,277 are live websites and 2,395,705 redirect to them.
- 375 of the top 1000 websites by traffic use Cloudflare.
- The United States accounts for the most websites on Cloudflare globally, with 19,949,846.
- In 2024, Cloudflare had 238,000 paying customers.
- It also has 3,497 customers with an annual revenue of more than $100,000 a year.
- Cloudflare said it had revenue of $1.6 billion in 2024.
- The United States contributed 51% of Cloudflare’s revenue in 2024 with sales of $849,500.
Cloudflare Outage Statistics
Because Cloudflare’s network handles about 20% of the world’s web traffic, outages can have a major ripple effect across the internet. Below are some of the most significant outages and how they affected:
The November 18, 2025, Cloudflare outage was caused by an oversized configuration file for the Bot Management feature, which crashed proxy servers globally and impacted services such as X (formerly Twitter) and Spotify.
On December 5, 2025, another outage stemmed from an erroneous Web Application Firewall (WAF) rule intended to address a security vulnerability, resulting in widespread 5xx errors and affecting major websites, including LinkedIn, Zoom, and Discord.
| Date | Outage Lasted | Reason |
|---|---|---|
| November 18, 2025 | ~4 hours to resolve the main impact (total 6 hours of restoration) | Database permission issue caused bot-detection to generate oversized config → cascading network failures |
| March 21, 2025 | 1 hour 7 minutes | Missing environment variable during credential rotation → invalid keys broke R2 writes & degraded reads |
| September 16, 2024 | ~90 minutes | Network performance issue → regional reachability failures (HubSpot, Zoom) |
| November 2, 2023 | ~20 minutes | Network-wide failure → thousands of websites offline & incorrect Bitcoin price data |
| October 4, 2023 | Nearly 3 hours | DNSSEC validation failure → expired root zone signature during ZONEMD rollout → 1.1.1.1 SERVFAIL spikes |
| January 24, 2023 | 121 minutes | Code release corrupted service token metadata → Zero Trust + CDN control plane issues |
| June 21, 2022 | ~1.5 hours | Critical internal incident → broad connectivity failures & 500 errors |
| July 17, 2020 | Brief outage | Misconfigured backbone router broadcast faulty routes → major sites offline |
| August 30, 2020 | ~5 hours | CenturyLink network failure → huge spike in HTTP errors across Cloudflare data centers |
| June 24, 2019 | ~3 hours | Verizon BGP misrouting → massive traffic redirection → widespread outages |
As global cyber attacks now exceed 2,200 incidents/day, Cloudflare’s role in mitigating threats and ensuring uptime has become more critical than ever.
Source: Cloudflare Blogs
Cloudflare Usage Statistics
Currently, 41,880,982 websites use Cloudflare, of which 39,485,277 are live websites and 2,395,705 redirect to them.
26,209,176 additional websites used Cloudflare.
Between 2025/10/25 and 2025/11/01, a total of 9,361,845 additional websites were live on Cloudflare’s platform.
The following table presents the growth of the live websites over time, in days, from 2024/01/06 up to 2025/11/01:
| Date | Live Websites |
|---|---|
| 2025/11/01 | 39,485,277 |
| 2025/10/25 | 39,343,320 |
| 2025/08/02 | 29,981,475 |
| 2025/05/10 | 25,886,414 |
| 2025/02/22 | 24,863,687 |
| 2024/11/30 | 22,876,034 |
| 2024/09/07 | 22,350,209 |
| 2024/06/15 | 20,715,193 |
| 2024/03/23 | 15,724,589 |
| 2024/01/06 | 15,096,945 |
Source: Built With
Cloudflare Websites by Traffic
At present, 375 of the top 1000 websites by traffic use Cloudflare.
In a similar fashion, 48.7% of the top 1 million traffic sites are on Cloudflare.
With Google Chrome controlling 68.35% of the global browser market, Cloudflare’s optimization for Chromium-based browsers directly influences the majority of user experiences online.
The following table lists the top sites by traffic that use Cloudflare.
| Traffic | Websites |
|---|---|
| Top 1 million | 487,280 |
| Top 100k | 45,530 |
| Top 10k | 4,256 |
| Top 1000 | 375 |
| Outside Top 1m | 38,831,409 |
Source: Built With
Mobile devices (43.1%) account for a smaller number of HTTP requests than desktops (56.9%).
Mobile devices drive over 62.45% of all global internet traffic, making Cloudflare’s mobile performance and routing optimizations crucial for modern web delivery.
70.3% of traffic overall is generated by humans, and 29.7% by bots
Source: Cloudflare Radar
Cloudflare Websites By Country
The United States accounts for the most websites on Cloudflare globally, with 19,949,846, primarily due to high internet penetration.
These top 10 countries have a combined population of 25,952,866 websites on Cloudflare.
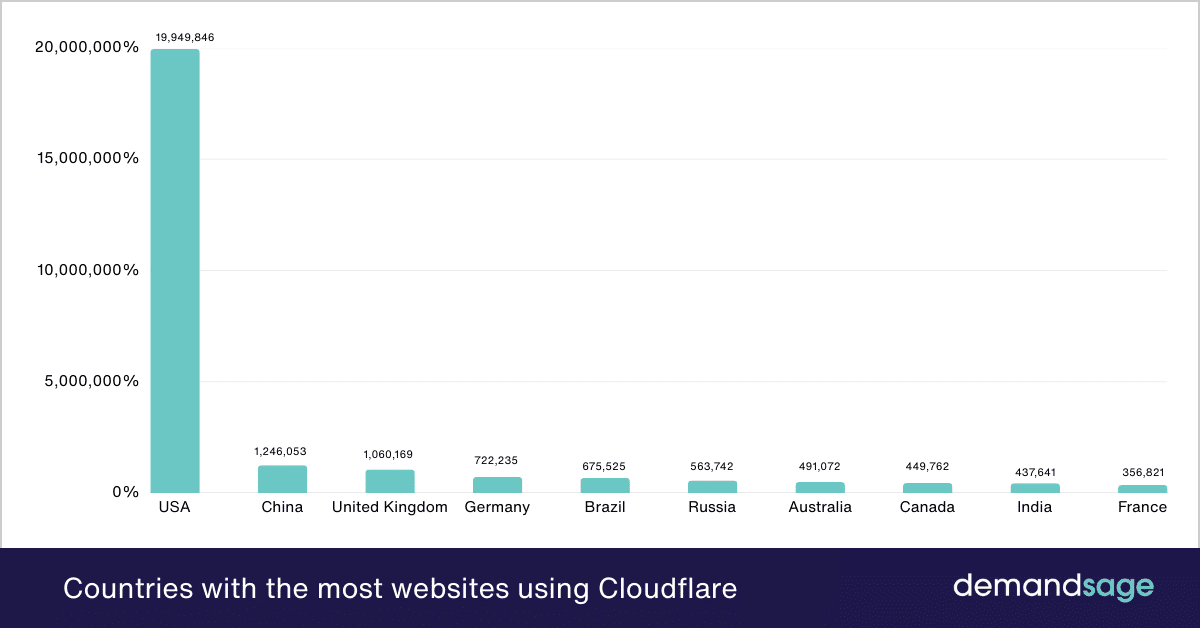
The table below will provide you with an overview of which countries have higher website numbers using Cloudflare:
| Country | Websites |
|---|---|
| United States | 19,949,846 |
| China | 1,246,053 |
| United Kingdom | 1,060,169 |
| Germany | 722,235 |
| Brazil | 675,525 |
| Russia | 563,742 |
| Australia | 491,072 |
| Canada | 449,762 |
| India | 437,641 |
| France | 356,821 |
Source: Built With
Cloudflare Customers
In 2024, Cloudflare had 238,000 paying customers in over 190 countries.
Paying customers at Cloudflare have increased by 221.6% from 2019 to 2024.
According to Cloudflare’s 2024 financials, the ARPU was approximately $6,723.
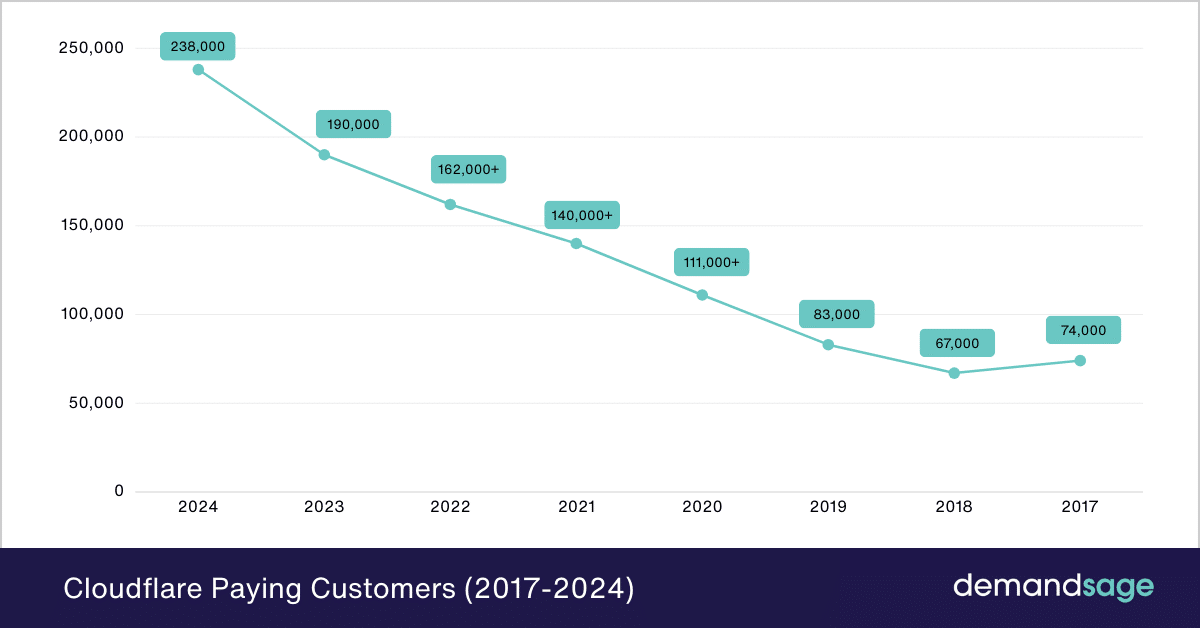
The table below shows the count of Cloudflare’s paying customers:
| Year (as of Dec 31) | Paying Customers | Countries Served |
|---|---|---|
| 2024 | 238,000 | 190+ |
| 2023 | 190,000 | 120+ |
| 2022 | 162,000+ | 180+ |
| 2021 | 140,000+ | 170+ |
| 2020 | 111,000+ | 170+ |
| 2019 | 83,000 | 160+ |
| 2018 | 67,000 | 160+ |
| 2017 | 74,000 | 160+ |
With the global SaaS industry now valued at $247.2 billion, Cloudflare’s expanding customer base of 238,000 paying users reflects the broader shift toward cloud-delivered infrastructure services.
Cloudflare’s large customers are those whose annual revenue exceeds $100,000.
It served 3,497 large customers as of 2024. Since 2017, Cloudflare’s large customer base has grown by 1,801%.
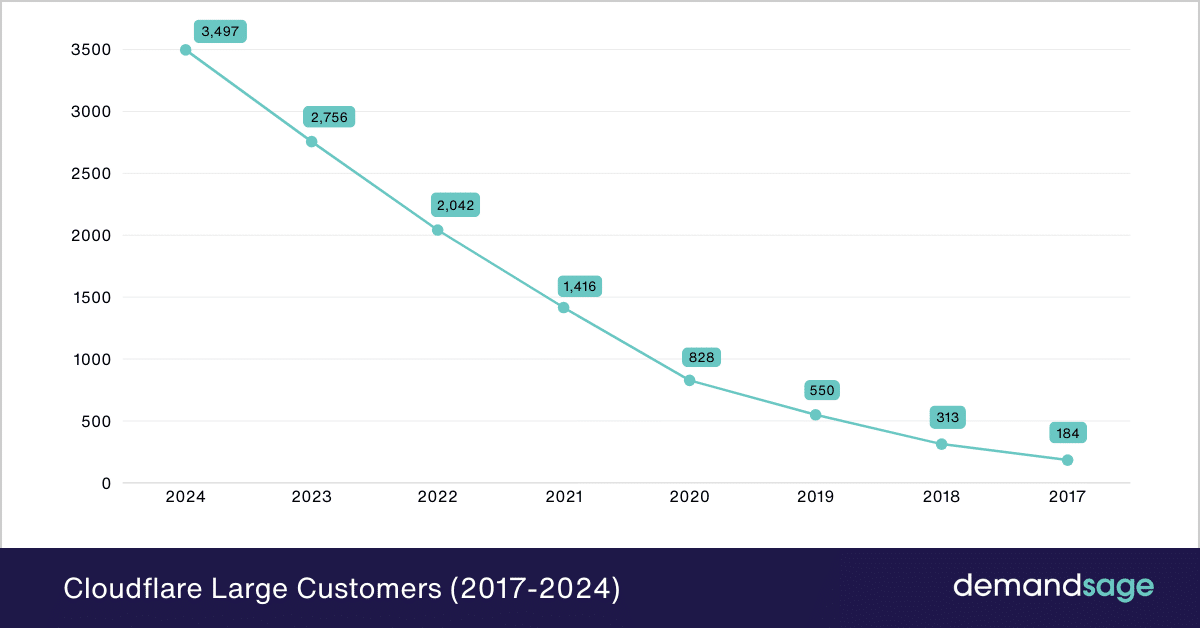
Let’s have a look at the growth of Cloudflare’s large customer base:
| Year (as of Dec 31) | Large Customers |
|---|---|
| 2024 | 3,497 |
| 2023 | 2,756 |
| 2022 | 2,042 |
| 2021 | 1,416 |
| 2020 | 828 |
| 2019 | 550 |
| 2018 | 313 |
| 2017 | 184 |
In 2024, Cloudflare had 35% of the Fortune 1,000 as its paying customers.
Cloudflare had more than 10% of the Fortune 1,000 as its paying customers in 2019, which grew to 17% in 2020.
Source: SEC Filings, Cloudflare Blog
Cloudflare Traffic Stats
Cloudflare is used by 81.5% of websites that use reverse proxies. This accounts for 20.4% of all websites.
Given that mobile devices generate 63.05% of all website traffic, DNS service providers play a central role in optimizing both mobile and desktop delivery at scale.
Source: W3Techs
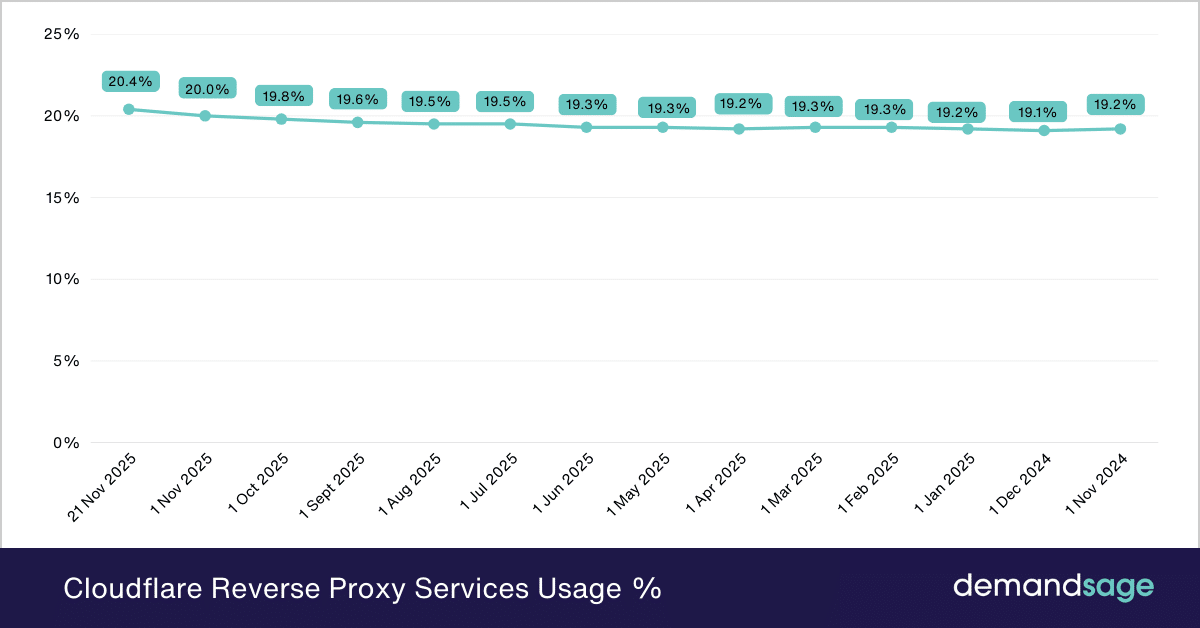
Below is a table showing Cloudflare’s website %:
| Date | Reverse Proxy Services Usage % |
|---|---|
| 21st November, 2025 | 20.4% |
| 1st November, 2025 | 20.0% |
| 1st October, 2025 | 19.8% |
| 1st September, 2025 | 19.6% |
| 1st August, 2025 | 19.5% |
| 1st July, 2025 | 19.5% |
| 1st June, 2025 | 19.3% |
| 1st May, 2025 | 19.3% |
| 1st April, 2025 | 19.2% |
| 1st March, 2025 | 19.3% |
| 1st February, 2025 | 19.3% |
| 1st January, 2025 | 19.2% |
| 1st December, 2024 | 19.1% |
| 1st November, 2024 | 19.2% |
Globally, Cloudflare is the leading reverse proxy service, with its market dominance increasing gradually.
Amazon CloudFront, Cloudflare’s closest competitor, holds 1.6% of the reverse proxy market share.
About three-fourths (75%) of websites do not use any reverse proxy services, leaving a large untapped market.
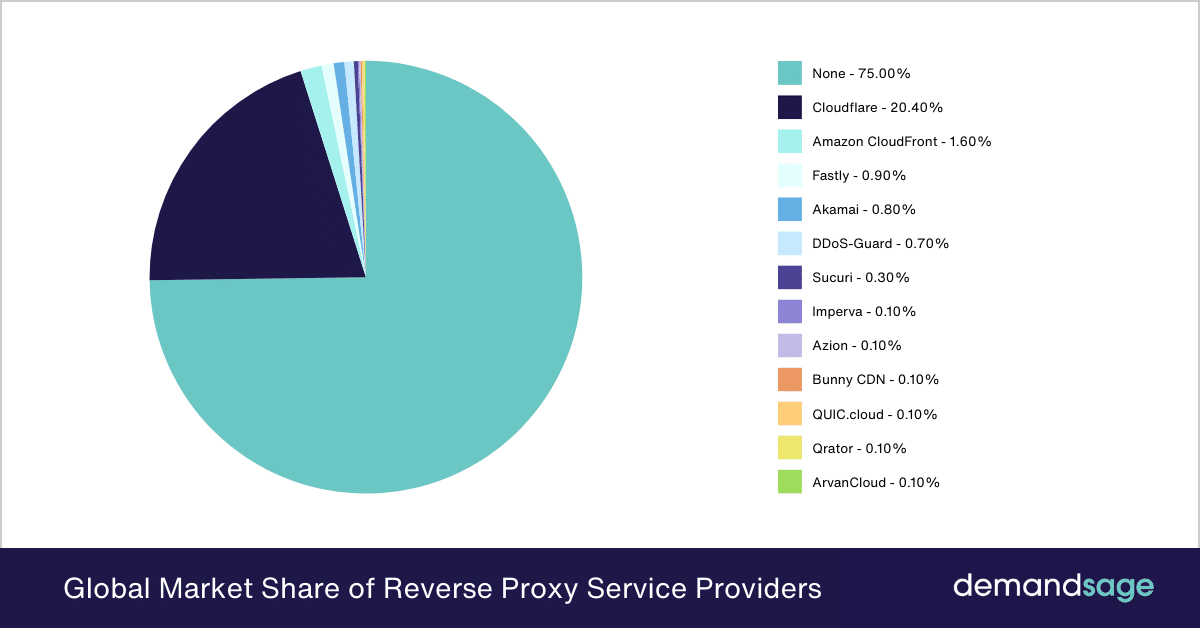
Let’s have a look at what % of websites use Cloudflare or other reverse proxy services:
| Reverse Proxy Services Providers | Website % Using Them |
|---|---|
| None | 75.00% |
| Cloudflare | 20.40% |
| Amazon CloudFront | 1.60% |
| Fastly | 0.90% |
| Akamai | 0.80% |
| DDoS-Guard | 0.70% |
| Sucuri | 0.30% |
| Imperva | 0.10% |
| Azion | 0.10% |
| Bunny CDN | 0.10% |
| QUIC.cloud | 0.10% |
| Qrator | 0.10% |
| ArvanCloud | 0.10% |
Source: W3Techs
Cloudflare Revenue
Cloudflare reported $1.67 billion in revenue in 2024.
Cloudflare’s trailing twelve-month (TTM) revenue as of December 2025 is $2.01 billion.
Although Cloudflare has a significant market share in the CDN and web security space, its annual revenue remains substantially lower than Akamai’s $3.9 billion, reflecting Akamai’s larger enterprise base and diversified services.
Since 2016, the revenue has grown by 1871%.
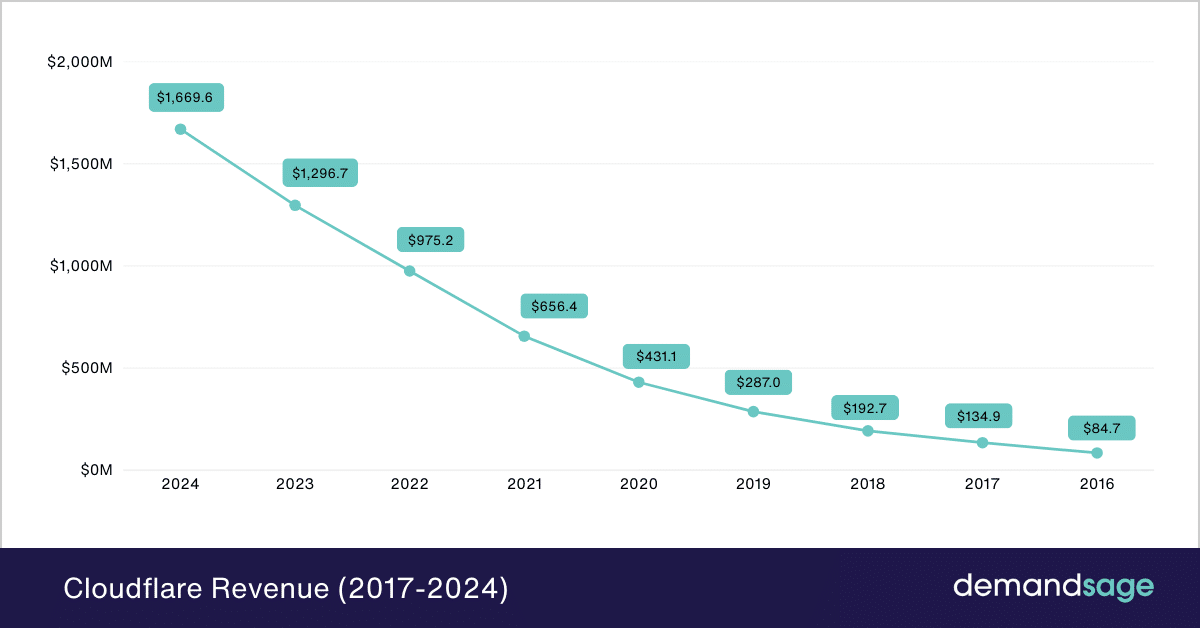
Have a look at the annual revenue growth of Cloudflare:
| Year | Revenue (in millions) |
|---|---|
| 2024 | $1,669.6 |
| 2023 | $1,296.7 |
| 2022 | $975.2 |
| 2021 | $656.4 |
| 2020 | $431.1 |
| 2019 | $287.0 |
| 2018 | $192.7 |
| 2017 | $134.9 |
| 2016 | $84.7 |
Now, let us have a look at Cloudflare’s quarterly revenue performance:
| Quarter | Revenue (in millions) |
|---|---|
| Q2 2020 | $99.72 |
| Q3 2020 | $114.16 |
| Q4 2020 | $125.92 |
| Q1 2021 | $138.05 |
| Q2 2021 | $152.42 |
| Q3 2021 | $172.34 |
| Q4 2021 | $193.59 |
| Q1 2022 | $212.16 |
| Q2 2022 | $234.51 |
| Q3 2022 | $253.85 |
| Q4 2022 | $274.7 |
| Q1 2023 | $290.17 |
| Q2 2023 | $308.49 |
| Q3 2023 | $335.6 |
| Q4 2023 | $362.47 |
| Q1 2024 | $378.6 |
| Q2 2024 | $400.99 |
| Q3 2024 | $430.08 |
| Q4 2024 | $459.94 |
| Q1 2025 | $479.08 |
| Q2 2025 | $512.31 |
| Q3 2025 | $562.027 |
Source: SEC Filings
Cloudflare US Revenue Breakdown
The United States has consistently accounted for almost 50% (or more) of Cloudflare’s revenue since 2016.
It reported $849 million in revenue and a 51% revenue share in 2024.
Cloudflare’s US revenue has grown by 1867.4% since 2016.
The table below shows the US’s revenue growth and its % share from 2016:
| Year | United States (Revenue in Thousands) | Revenue Share % |
|---|---|---|
| 2024 | $849,500 | 51% |
| 2023 | $678,184 | 52% |
| 2022 | $515,722 | 53% |
| 2021 | $342,578 | 52% |
| 2020 | $218,191 | 51% |
| 2019 | $144,575 | 50% |
| 2018 | $92,652 | 48% |
| 2017 | $64,940 | 48% |
| 2016 | $43,185 | 51% |
Source: SEC Filings
Cloudflare EMEA Revenue Breakdown
EMEA (Europe, Middle East & Africa) recorded revenue of $466 million in 2024, a 2537% increase from 2016’s $17 million.
The largest increase in revenue occurred between 2023 and 2024, rising from $ 356,499 to $ 466,429.
The table below presents the revenue growth and % share in EMEA from 2016:
| Year | EMEA (Revenue in Thousands) | Revenue Share % |
|---|---|---|
| 2024 | $466,499 | 28% |
| 2023 | $356,569 | 28% |
| 2022 | $258,291 | 26% |
| 2021 | $172,129 | 26% |
| 2020 | $109,274 | 25% |
| 2019 | $68,418 | 24% |
| 2018 | $48,438 | 25% |
| 2017 | $31,882 | 24% |
| 2016 | $17,688 | 21% |
Source: SEC Filings
Cloudflare APAC Revenue Breakdown
APAC (Asia Pacific) generated a revenue of $223 million in FY 2024.
The region held the largest revenue share in 2018, at 20%.
APAC’s Cloudflare revenue has grown by 2,527% since 2016.
The table below details APAC’s revenue growth and corresponding % share from 2016 onward:
| Year | Asia Pacific (Revenue in Thousands) | Revenue Share % |
|---|---|---|
| 2024 | $223,234 | 13% |
| 2023 | $168,826 | 13% |
| 2022 | $133,353 | 14% |
| 2021 | $96,537 | 15% |
| 2020 | $76,177 | 18% |
| 2019 | $55,131 | 19% |
| 2018 | $38,851 | 20% |
| 2017 | $15,465 | 11% |
| 2016 | $8,498 | 10% |
Source: SEC Filings
Cloudflare Other Regions Revenue Breakdown
Regions outside the US, APAC, and EMEA have considerably lower revenue and revenue share, as they combine several business regions.
From 2016, the revenue in other regions has grown by 2,329%.
The table below shows the revenue growth and percentage share of other regions from 2016:
| Year | Other (Revenue in Thousands) | Revenue Share % |
|---|---|---|
| 2024 | $130,393 | 8% |
| 2023 | $93,166 | 7% |
| 2022 | $67,875 | 7% |
| 2021 | $45,182 | 7% |
| 2020 | $27,417 | 6% |
| 2019 | $18,898 | 7% |
| 2018 | $12,733 | 7% |
| 2017 | $8,203 | 6% |
| 2016 | $5,367 | 6% |
Source: SEC Filings
Cloudflare Employee Count
Cloudflare had 4,263 employees in 2024 (as per the last recorded data).
Cloudflare’s employee count has grown by 689% since 2017.
The table below shows annual employee growth at Cloudflare from 2017:
| Year | Employee Count |
|---|---|
| 2024 | 4,263 |
| 2023 | 3,682 |
| 2022 | 3,217 |
| 2021 | 2,439 |
| 2020 | 1,788 |
| 2019 | 1,270 |
| 2018 | 865 |
| 2017 | 540 |
Source: SEC Filings
