
TikTok Shop has more than 15 million sellers worldwide and is expected to reach $123.5 billion in global GMV in 2026. In the US, sales reached $15.8 billion in 2025, with more than 215,000 small businesses selling on the platform.
TikTok went from being a video-sharing platform to now driving major e-commerce and business sales globally. Creators, short videos, and live shopping now play a big role in what shoppers see and buy on TikTok.
In this article, you’ll find the latest TikTok Shop statistics on sellers, GMV, US sales, shopper demographics, top-selling categories, creators, and holiday sales.
TikTok Shop Statistics: Key Takeaways
- TikTok Shop has more than 15 million sellers worldwide today.
- Global TikTok Shop GMV could reach $123.5 billion in 2026.
- US TikTok Shop sales reached $15.8 billion during 2025.
- Beauty and personal care lead TikTok Shop product sales.
- Creators drive around 42% of US TikTok Shop sales.
- Users aged 25 to 34 make up the largest group.
How Many Sellers Are There on TikTok Shop?
TikTok Shop has more than 15 million sellers worldwide. In the US, more than 215,000 small businesses actively sell on the platform.
The UK is another major market, with around 200,000 small and midsize sellers. The seller base has grown quickly as TikTok Shop becomes a bigger part of online shopping.
But there’s one important detail that often gets missed. A seller count isn’t the same as a store count. Some reports show hundreds of thousands of stores, but many of these stores have never made a sale. So, the total number of stores can look much bigger than the number of businesses that are actually selling.
Source: eMarketer, CNBC, Modern Retail
TikTok Shop Sellers by Country
TikTok Shop has sellers around the world, but they aren’t spread evenly. Most shops are in Southeast Asia, with Indonesia, Thailand, and Vietnam having the largest numbers.
But having more shops doesn’t always mean more sales. Although Southeast Asia has the most number of shops, the US brings in the most sales.
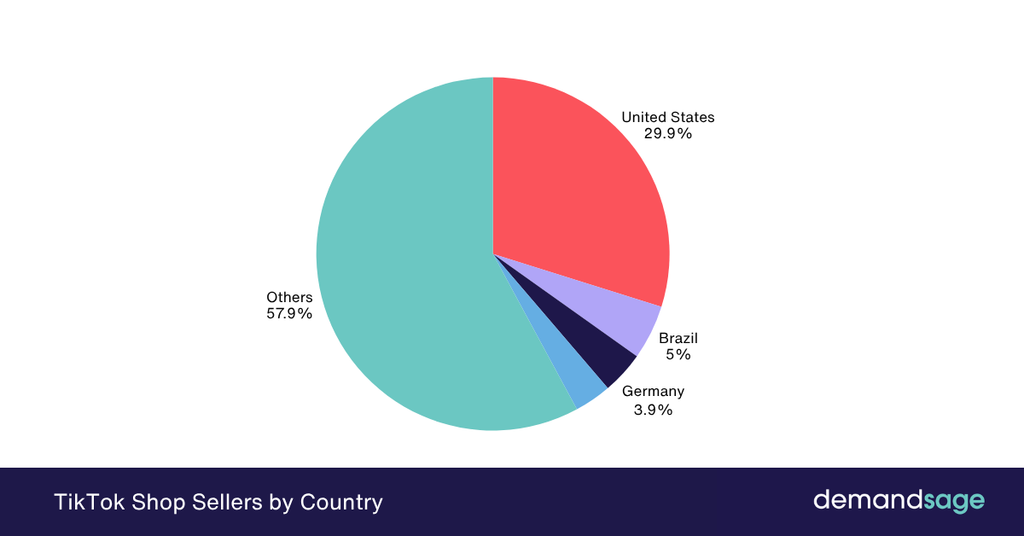
The table below shows the TikTok Shop sellers by country.
| Country | Distribution % |
|---|---|
| United States | 29.85% |
| Brazil | 4.98% |
| Germany | 3.9% |
| Canada | 3.38% |
| Others | 57.89% |
Source: Statista
What stands out is the gap between the US and the rest. No other country comes close to the US share.
TikTok has sellers around the world, but most shops are in just a few key markets. In other countries, the number of shops is much lower.
TikTok Shop GMV Growth
TikTok Shop sales have grown rapidly, roughly doubling or more in most years. Estimates indicate TikTok Shop GMV growth in 2026 to be $123.5 billion, almost double from 2025 at $64.3 billion.
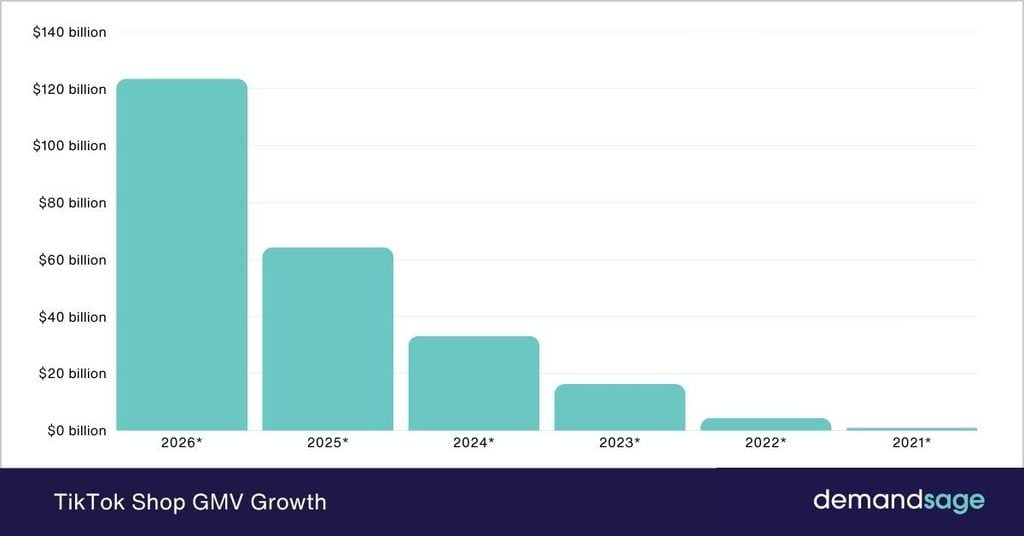
Here’s the global GMV growth from 2021 to 2026 (estimated) below:
| Year | Global GMV | YoY Growth Rate |
|---|---|---|
| 2026 (est.) | $123.5 billion | 92.0% |
| 2025 | $64.3 billion | 93.7% |
| 2024 | $33.2 billion | 103.7% |
| 2023 | $16.3 billion | 270.5% |
| 2022 | $4.4 billion | 340.9% |
| 2021 | <$1 billion | – |
Note: GMV isn’t the same as TikTok Shop revenue. GMV is the total amount shoppers spend on the platform. TikTok takes a percentage of each sale through fees and commissions.
US TikTok Shop Revenue Statistics
US TikTok Shop sales have already passed $15 billion and are expected to go above $20 billion in 2026.
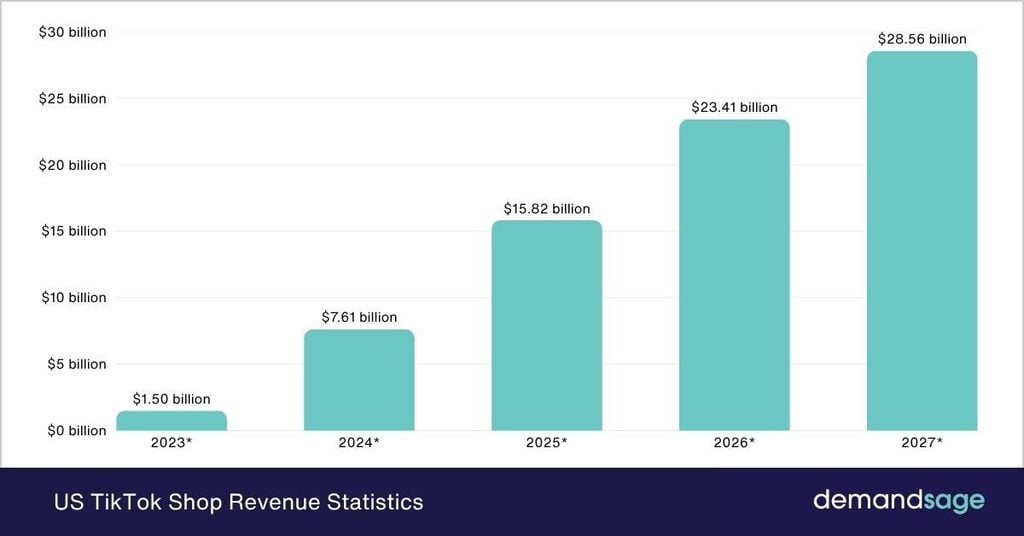
Sales reached about $15.8 billion in 2025, making up 18.2% of all US social commerce. The first half of 2026 also showed strong growth, with US GMV reaching $11.8 billion, more than double the same period a year earlier.
| Year | Retail Ecommerce Sales | Total e-commerce sales |
|---|---|---|
| 2023 | $1.50 billion | – |
| 2024 | $7.61 billion | 10.6% |
| 2025 | $15.82 billion | 18.2% |
| 2026* | $23.41 billion | 22.8% |
| 2027* | $28.56 billion | 24.1% |
*Estimated numbers
One policy change also had a big effect on the market. When the US ended the de minimis import exemption in May 2025, sales from foreign sellers sharply fell. That changed the mix of sellers on TikTok Shop, with domestic businesses picking up more of the demand.
Source: CNBC, eMarketer, Axis Intelligence
TikTok Shop GMV by Country
Indonesia and the US are competing closely for the top spot in TikTok Shop GMV at $14.88 billion and $14.19 billion. Thailand follows at $9.58 billion.
| Country | GMV |
|---|---|
| Indonesia | $14.88 billion |
| United States | $14.19 billion |
| Thailand | $9.58 billion |
Note: These are GMV figures, the total value of goods sold. That’s a different measure from the $15.82 billion in US retail sales figure from earlier.
Southeast Asia still accounts for a large part of TikTok Shop’s sales, but the US has been catching up quickly.
One reason is the size of each order. US shoppers spend more compared to shoppers in Southeast Asia. So the US doesn’t need as many buyers to generate similar sales. The orders are simply much bigger.
Source: Statista, Statista 2
TikTok Shop Statistics by Region and Country
Indonesia, Thailand, and Vietnam have the largest number of TikTok Shop stores in the world, with 56.35% of the total.
The numbers look different when you count shops instead of sales.
| Region/Country | Stores | Percentage |
|---|---|---|
| Indonesia | 54.28K | 20.52% |
| Thailand | 48.37K | 18.29% |
| Vietnam | 46.38K | 17.54% |
| Malaysia | 34.23K | 12.94% |
| United States | 31.29K | 11.83% |
| Philippines | 30.78K | 11.64% |
| United Kingdom | 16.38K | 6.19% |
| Singapore | 2.74K | 1.04% |
| Saudi Arabia | 24 | <0.01% |
| Others | 14 | <0.01% |
Source: AfterShip
TikTok Shop User Demographics
Adults make up a large share of TikTok Shop’s audience. Shoppers aged 25 to 34 are the biggest group, and millennials are among the platform’s most active buyers.
This aligns with broader TikTok user demographics, which show that adults make up a significant portion of the platform’s user base.
Source: eMarketer
TikTok Shop Users by Age
Visitors aged 25 to 34 make up the largest age group, accounting for 34.88% of TikTok Shop’s website traffic. Here’s a breakdown by age group.
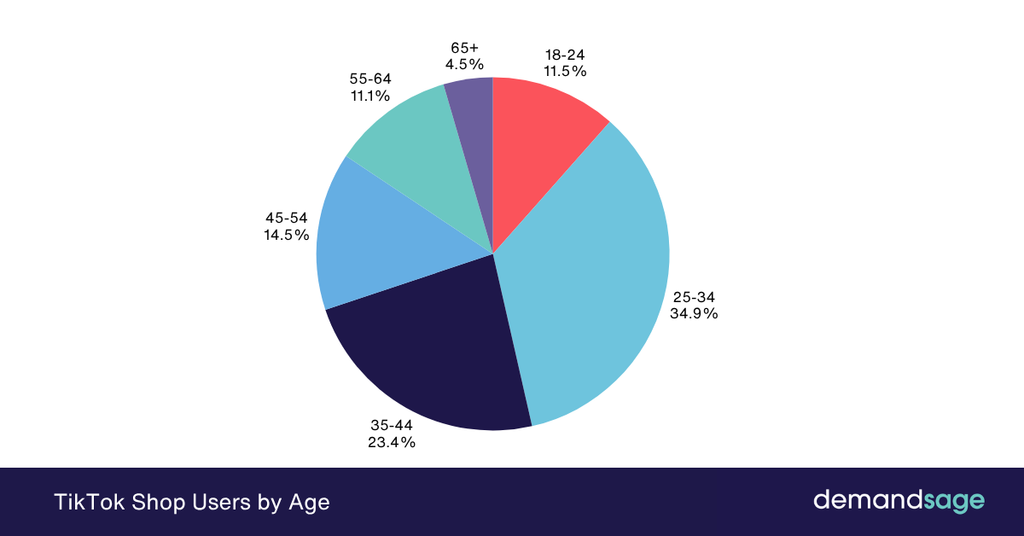
The table below highlights TikTok Shop users by age:
| Age Group | Share of Users |
|---|---|
| 18-24 | 11.52% |
| 25-34 | 34.88% |
| 35-44 | 23.41% |
| 45-54 | 14.47% |
| 55-64 | 11.11% |
| 65+ | 4.52% |
More than a third of website visitors are between 25 and 34. Add visitors aged 35 to 44, and adults make up a big part of the audience.
So if your product is aimed at working adults, TikTok Shop has a strong audience for it.
Source: Similarweb
TikTok Shop Users by Gender
The gender split of TikTok Shop is almost even, with the web traffic slightly higher among men.
| Gender | Share of Users |
|---|---|
| Male | 51.3% |
| Female | 48.7% |
These figures are based on visits to the TikTok Shop website, not all buyers inside the app. The actual mix can look different by category. Beauty and fashion, for example, tend to attract more female shoppers.
Source: Similarweb
TikTok Shop Traffic and Engagement Statistics
In July 2026, TikTok Shop received 669,698 visits, up 4.45% from the previous month, showing steady growth in website traffic.
TikTok Shop Traffic by Country
The US saw the biggest increase in traffic, up 82.55%. It also had the largest share of traffic at 20.70%.
This increase is notable because it follows the strong growth in TikTok Shop sales, showing that interest in the market continues to rise.
| Country | Traffic | Change Rate |
|---|---|---|
| United States | 20.7% | ↑82.55% |
| Indonesia | 17.53% | ↑5.4% |
| Brazil | 15.36% | ↓6.86% |
| China | 13.47% | ↑12.2% |
| Thailand | 5.29% | ↑30.53% |
| Others | 27.65% | – |
Source: Similarweb
TikTok Shop Engagement Statistics
Visitors spend more than four minutes on the site and view nearly six pages per visit. This suggests that many visitors browse through multiple pages and products during their visit.
| Metric | Value |
|---|---|
| Monthly Visits (July 2026) | 669,698 |
| Growth rate | ↑4.45% |
| Bounce Rate | 41.03% |
| Pages per visit | 5.85 |
| Visit Duration | 4 minutes 8 seconds |
Source: Similarweb
TikTok Shop Engagement by Device
Desktop makes up most TikTok Shop website visits, which looks surprising at first but makes more sense when you consider who uses the site.
| Device | Share |
|---|---|
| Desktop | 73.19% |
| Mobile web | 26.81% |
Source: Similarweb
Best-Selling Categories on TikTok Shop
Beauty & personal care leads TikTok Shop product sales, followed by womenswear and food. These categories perform well because they are easy to show, explain, and promote in short videos.
Take a look at the best-selling categories on TikTok:
| Category | Products Sold | Share |
|---|---|---|
| Beauty & Personal Care | 370.09 million | 18.65% |
| Womenswear & Underwear | 284.86 million | 14.36% |
| Food & Beverages | 138 million | 6.96% |
| Home Supplies | 137.47 million | 6.93% |
| Fashion Accessories | 97.93 million | 4.94% |
| Muslim Fashion | 96.92 million | 4.88% |
| Menswear & Underwear | 94.9 million | 4.78% |
| Baby & Maternity | 90.72 million | 4.57% |
| Shoes | 77.82 million | 3.92% |
| Phones & Electronics | 68.97 million | 3.48% |
Beauty products are a good example. A seller can show how a product looks, how to use it, or what it does without needing a long explanation. This makes the category a good fit for the TikTok Shop.
Source: AfterShip
Top TikTok Shop Categories by Revenue
Beauty & personal care also leads when you look at GMV, meaning the total value of the products sold. It is followed by women’s and men’s wear, showing that fashion is also a major part of TikTok Shop sales. Take a look at the table below showcasing categories, ranked by revenue.
| Category | GMV | Share |
|---|---|---|
| Beauty & Personal Care | $2.49 billion | 22.50% |
| Womenswear & Underwear | $1.39 billion | 12.56% |
| Menswear & Underwear | $893.54 million | 8.06% |
| Food & Beverages | $759.84 million | 6.85% |
| Health | $600.42 million | 5.42% |
| Muslim Fashion | $506.00 million | 4.56% |
| Home Supplies | $457.50 million | 4.13% |
| Phones & Electronics | $430.50 million | 3.88% |
| Baby & Maternity | $412.59 million | 3.72% |
| Shoes | $403.50 million | 3.64% |
Source: AfterShip
Looking at both tables together gives a better picture of what sells on TikTok Shop. Menswear is a good example. It sells fewer products than food and beverages, but generates more GMV. That means shoppers spend more per item.
That same idea applies across other categories. A category can sell a large number of low-priced products without generating as much GMV as a category with fewer, more expensive products.
That’s why product volume alone doesn’t tell the whole story.
For sellers, the takeaway is simple. Products don’t need to be the cheapest to perform well. What matters is whether they’re easy to discover, easy to understand, and worth buying after seeing them in a short piece of content.
TikTok Shop Creator and Affiliate Statistics
Creators are a major sales driver on TikTok Shop, especially in the US.
- Affiliate content accounts for about 42% of US TikTok Shop sales, making it one of the biggest sales channels on the platform.
- More than 100,000 creators are part of TikTok Shop’s affiliate program, but only around 54,000 make more than $10,000 a year through affiliate sales.
- For brands, working with 20 to 30 mid-size creators can be a better approach than putting all the focus on one big creator. It can help reach different audiences and keep new content coming from several creators. Brands can also combine creator-led content with paid promotion, and those planning to advertise on TikTok can check the latest TikTok Ads coupon offers for available ad credits. The key isn’t just finding creators with a large following. It’s finding creators who can turn views into actual sales.
The key isn’t just finding creators with a large following. It’s finding creators who can turn views into actual sales.
Source: TikTok, TikTok 2, WeCanTrack, Capital One Shopping, Ringly
TikTok Shop Conversion Rates and Live Shopping
- TikTok Shop can turn browsers into buyers at a strong rate, with regular affiliate videos often converting around 3% to 6%. Live shopping can reach 8% to 12%.
Live selling works because hosts can answer questions, demonstrate products, and create urgency while shoppers are watching. But live shopping isn’t the whole story.
- In early 2026, live made up 8.2% of US TikTok Shop sales, down from 14% in 2025.
- At the same time, live shopping itself kept growing. Live hours increased by more than 80%, showing sales growth came partly from spending more time on camera.
For sellers, the better approach is to use live shopping alongside short videos and the Shop tab, rather than relying on live sessions alone.
Source: CNBC, TikTok, PartnerCentric, TikTok Newsroom
TikTok Shop Black Friday and Holiday Statistics
The 2025 holiday season was a huge one for TikTok Shop in the US. Sales passed $500 million during the four-day Black Friday to Cyber Monday period.
- Shopper numbers also climbed nearly 50% from the previous year, showing that more people were turning to TikTok Shop for holiday shopping.
- Live shopping was a major part of that growth. Live sales rose 84%, with shoppers watching more than 760,000 live sessions and generating over 1.6 billion views.
- The difference from 2024 was significant. TikTok made about $100 million in US sales during Black Friday that year, so sales were roughly five times higher in 2025.
- Larger sellers saw growth too, with businesses making at least $10 million a year reporting a 76% increase in holiday sales.
These figures show how much TikTok Shop has grown during the holiday season, with both live shopping and creator content helping sellers drive sales.
Source: TikTok Newsroom, TubeFilter
Is TikTok Shop Still Growing?
Yes, TikTok Shop is growing and becoming a serious rival to Amazon for product discovery. Its share of US social ecommerce is expected to keep growing, reaching nearly a quarter of the market by 2027.
What stands out is how people discover products. One survey found that 67% of shoppers use TikTok Shop to find new products, compared with 57% who use Amazon for the same reason.
Shopping habits are changing. Instead of searching for a product they already have in mind, people often come across something while watching videos and decide to buy it.
Furthermore, TikTok Shop is growing fast, but selling on the platform is likely to get more competitive. As more sellers join, more products are fighting for the same viewers, clicks, and sales.
Source: eMarketer, Modern Retail
