
Startups are a driving force in the global economy, with over 150 million startups worldwide. The United States leads with 1.56 million startups, followed by India with 493K startups.
Despite their growth, only about 10% of startups sustain long-term success, making the journey for entrepreneurs both challenging and exciting.
Let’s explore further details about the number of startups worldwide, in different countries, startup funding, and more in this article.
StartUp Statistics 2026: At A Glance
- There are more than 150 million startups worldwide, of which 1.56 million are in the United States.
- Global venture funding totaled $425 billion in 2025.
- Over 1,600 startups globally hold the unicorn badge.
- OpenAI is the most successful startup with a $850 billion valuation.
- The global startup failure rate is 90%.
- First-time founders have a startup success rate of 18%.
- Business owners who failed in the past have a slightly higher startup success rate of 20%.
- One-third of the startups fail due to the lack of product demand.
- The average cost of starting a business is $40,000.
Number Of Startups
On average, 137K startups are launched every day. However, most of them fail before reaching a well-established phase.
Let’s take a look at the number of startups that are running successfully.
There Are Over 150 Million Startups In The World
Around 50 million new startups are established every year. That means, on average, 137,000 startups are launched every day.
However, only 10% can sustain themselves in the long run.
Note: The data is from 2022, and for 2026, there is no exact count. But the estimates are over 150 million.
Source: Microsoft.
There are 1.56 million startups in the United States
Most of these startups in the USA emerge from Silicon Valley.
This makes the U.S. the country with the highest number of startups globally, followed by the United Kingdom, which has 1.19 million startups.

The following Table includes further details about the number of startups by country:
| Country | Number of Startups |
|---|---|
| United States | 1,560,000 |
| United Kingdom | 1,190,000 |
| India | 662,000 |
| Germany | 648,000 |
| Canada | 208,000 |
| China | 127,000 |
| France | 92,000 |
| Italy | 70,000 |
| Netherlands | 67,000 |
| Brazil | 56,000 |
| South Africa | 45,000 |
Source: Tracxn
Startup Failure Rates
9 in 10 startups that are launched fail. Only 10% of the startups worldwide survive.
This is because the majority of the startups are not well-planned and researched. Plus, most new startups have founders with no experience.
Let’s take a closer look at the facts about startup failures.
90% Of The Startups Fail
Around 10% of the startups fail within a year of establishment. At the same time, 70% of startups fail between the second and fifth years.
The startup failure rates increase over time. The majority of businesses throughout the industries fail within 10 years of establishment.
Hence, in the long run, 90% of the startups fail, and only 1 in 10 startups are able to survive.
Source: Failory.
Only 10% To 20% Of The Startups Become Successful In The Long Run
First-time business owners have a success rate of 18%. While the business owners who failed in the past have a slightly higher startup success rate.
On the other hand, business owners who have had a successful startup in the past have a success rate of around 30%.
Most successful startup owners claim they have the relevant qualifications and experience to run their own business.
Source: Small business trends, Failory.
80% Of The Startups In The United States Fail
Canada and France, too, have a similar failure rate.
The highest Startup failure rates are recorded in South Africa. The Major reasons are lack of funding, regulatory obstacles, infrastructure deficits, limited mentorship, frugality issues, and inadequate marketing and branding.
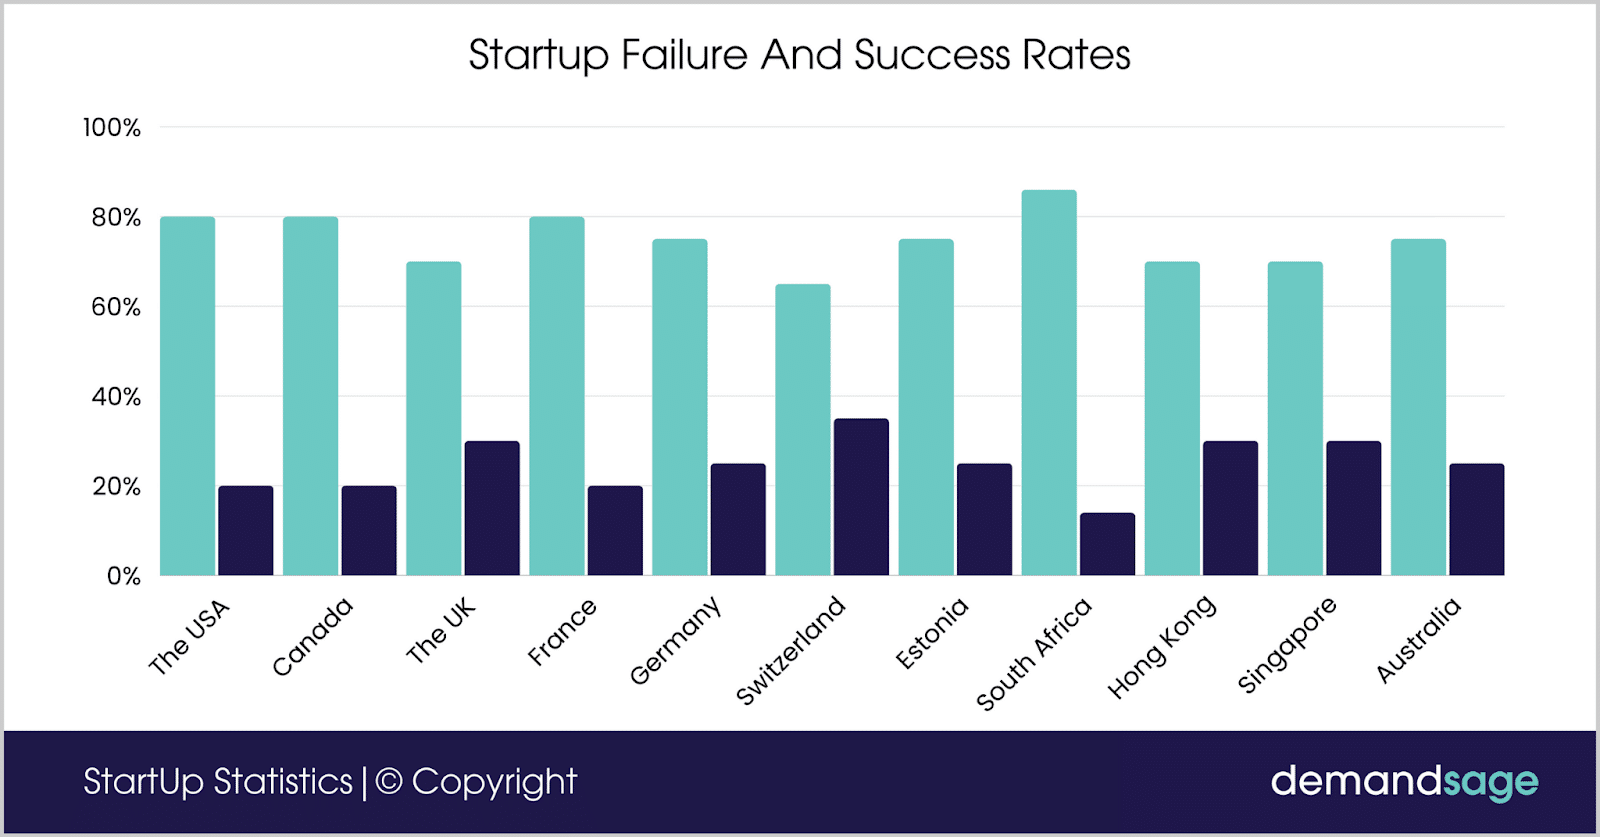
Here are further details about the startup failure and success rates recorded in different countries worldwide.
| Country | Startup Failure Rate | Startup Success Rate |
|---|---|---|
| The USA | 80% | 20% |
| Canada | 80% | 20% |
| The UK | 70% | 30% |
| France | 80% | 20% |
| Germany | 75% | 25% |
| Switzerland | 65% | 35% |
| Estonia | 75% | 25% |
| South Africa | 86% | 14% |
| Hong Kong | 70% | 30% |
| Singapore | 70% | 30% |
| Australia | 75% | 25% |
One-Third Of The Startups Fail Due To The Lack Of Product Demand
34% of the startups stated that their failure was due to a lack of demand for their products.
Meanwhile, 2 in 10 startups fail because they are not able to market their products properly.
Here are further reasons that contribute to the failure of a startup:
| Failure Reason | Percentage |
|---|---|
| Lack of Product Demand | 34% |
| Marketing Problems | 22% |
| Team Problems | 18% |
| Financial Problems | 16% |
| Technical Problems | 6% |
| Legal Problems | 2% |
| Operational Problems | 2% |
Source: Luisa Zhou.
Unicorn StartUps
Less than 1% of the startups are able to cross a valuation of $1 billion. These startups are known as Unicorn startups.
Some of the popular unicorn startups worldwide are Uber, Airbnb, SpaceX, and more.
There Are Over 1,624 Unicorn Startups From 48 Countries
Globally, 2,800 startups have achieved a valuation of more than $1 billion. Of these, only 1,624 are still private and venture-backed, while over 240+ are rumored and unverified.

About 1% of startups evolve into unicorn startups. Since 2018, more than 250 new unicorns have been created each year. However, in 2021, the number increased to 787.
There are over 1.7K Unicorn startups in the United States.
The United States has the highest number of Unicorn startups worldwide (1,720), followed by China with 438.
Other countries that make it to the top 5 with the highest number of unicorn startups are the United Kingdom, India, Israel, and Germany.
The following table provides further details about the countries with the highest number of Unicorn Startups.
| Country | Number Of Unicorn Startups in 2025 | Number Of Unicorn Startups in 2023 |
|---|---|---|
| USA | 1,720 | 1,500 |
| China | 438 | 348 |
| UK | 183 | 147 |
| India | 117 | 87 |
| Germany | 72 | 64 |
| Canada | 71 | 52 |
| Israel | 119 | 46 |
| France | 60 | 37 |
| Sweden | 46 | 37 |
| Netherlands | 33 | 29 |
Source: Dealroom, Failory
OpenAI is Currently The World’s Top Unicorn, with a valuation of $850 Billion
Recently, OpenAI has outranked SpaceX to become the most valuable startup, worth $850 billion. Meanwhile, SpaceX is very close with $800 billion
Following closely is ByteDance, the third-highest valued unicorn at $480 billion.
Here are further details about the top Unicorns worldwide and their Valuation:
| Company | Valuation (USD) |
|---|---|
| OpenAI | $850 billion |
| SpaceX | $800 billion |
| ByteDance | $480 billion |
| Anthropic | $380 billion |
| Stripe | $159 billion |
| Ant Group | $150 billion |
| Databricks | $134 billion |
| Waymo | $126 billion |
| Reliance Retail | $101 billion |
| Revolut | $75 billion |
Source: Crunchbase
The Average Cost Of Startups
The average cost to launch a startup may vary according to your niche, industry, products, services, and more.
Some people reported starting a business with just $5000, while others initially required $40,000 or more for their startup.
Let’s take a closer look at the average cost required to run a startup.
The Average Cost Of Starting A Business Is $40,000 In The First Year
This may vary depending on factors like industry, products, services, and store location.

The cheapest businesses may cost as little as $12,000 initially. In contrast, other businesses, like restaurants, may cost $400,000 or more.
The following table displays the average cost to start a business in different industries.
| Industry | The Average Cost To Start A Business |
|---|---|
| Food and restaurants | $375,000 |
| Construction | $37,390 |
| Retail | $39,210 |
| Arts | $32,960 |
| Entertainment | $12,272 |
Source: Bankrate.
Almost 58% Of The Small Business Owners Launched Their Businesses With Less Than $25,000
Almost 3 in 5 startups have less than $25,000 at their disposal during the startup phase. Meanwhile, a third of businesses start with less than $5000.
The U.S. Census Bureau recently found that the median cost of starting a small business is $25,000.
Source: CNBC.
Startup Funding Statistics
Funding enables startups to sustain and grow. Potential startups get good funding in different rounds, enabling them to succeed in the long run.
Most Unicorn startups managed to make it into the list with the help of these fundings and investments.
Here are some of the latest statistics about startup funding and investments.
Global Venture Funding in 2025 Totaled $425 Billion
This reflects a 30% increase from the previous year, when funding reached only $328 billion in 2024.
Artificial intelligence (AI) led the sectors by funding, with AI startups securing nearly $210 billion, making almost 50% of all venture capital.
Here’s a breakdown of 2025’s funding by all stages:
| Stages | Funding Amount |
|---|---|
| Angel-Seed | $39.8 billion |
| Early Stage | $124.9 billion |
| Late Stage | $242.8 billion |
| Technology growth | $17.5 billion |
Source: Crunchbase News
31% Of Startup Capital for Employer Firms Is Less Than $10,000
Meanwhile, 18% of startup capital for employer firms is $250,000 or more.
The average seed round is $2.2 million, which is 200 times the $10,000 of startup capital that the average small business needs.
Venture Capital Funding Reached $109 Billion In Q2 2025
This was a quarter-over-quarter drop of 17%.
The United States acquired 64% of the total VC fundraising. Meanwhile, software and AI companies acquired 45% of the total VC funding.
Source: Bain & Company
77% Of The Businesses Rely On Their Savings For The Initial Funds
Although about 100% of headlines on startup funding cover venture capital, only 0.05% of the startups raise venture capital.
The rest of the businesses raise the money for their startups through banks and loans, friends and family, credit cards, angel investors, and personal savings.
Source: Fundera.
Male Founders Received Venture Capital Funding Of $156.2 Billion, While Female Founders Received $28.1 Billion In 2022
The investments in companies founded by women reached $3.6 billion in 2022.
In 2023, the women-founded companies received just 2.1% of the total capital invested in venture-backed startups in the United States.
These stats bring the gender gap in the funding rounds into the limelight.
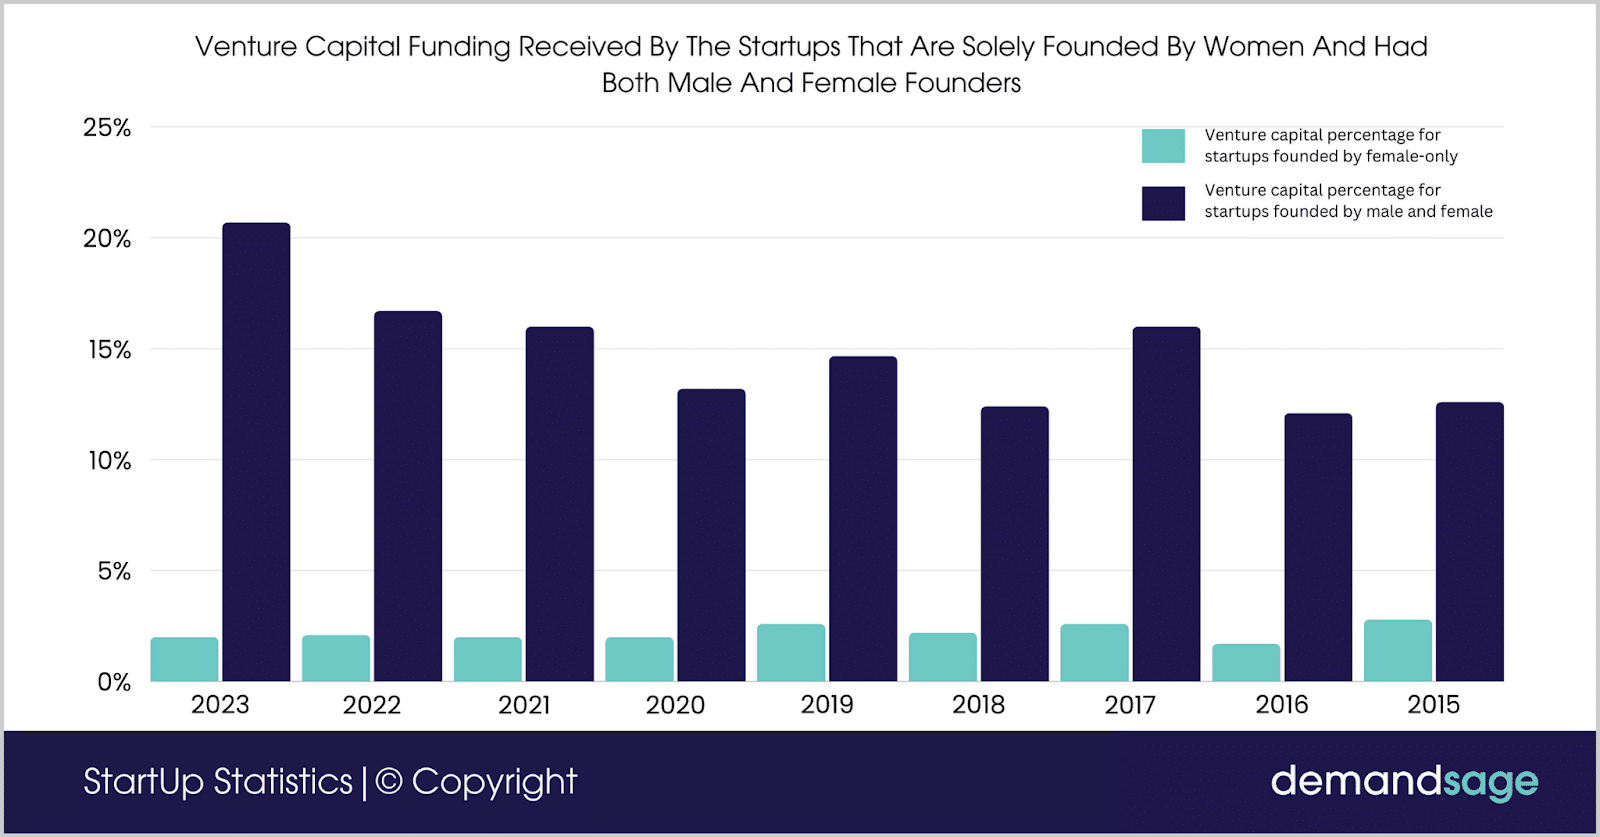
The following table displays the share of venture capital funding received by the startups that are solely founded by women and have both male and female founders.
| Year | VC Percentage For Startups Founded By Female-Only | VC Percentage For Startups Founded By Male And Female |
|---|---|---|
| 2025 | 6% | 17.8% |
| 2024 | 2.1% | 21.6% |
| 2023 | 2% | 20.7% |
| 2022 | 2.1% | 16.7% |
| 2021 | 2% | 16% |
| 2020 | 2% | 13.2%% |
| 2019 | 2.6% | 14.67% |
| 2018 | 2.2% | 12.4% |
| 2017 | 2.6% | 16% |
| 2016 | 1.7% | 12.1% |
| 2015 | 2.8% | 12.6% |
Source: Pitchbook
Startup Founder Demographics
The startup founders have different demographics worldwide. However, most startup founders are white men with an average age of over 40 years.
Here are further details about the demographics of the startup founders.
The Average Age Of A Startup Founder Is 42 Years Old
59% of the startup founders worldwide are over 40, and just 16% are between 20 and 30 years old.
According to the US Census Bureau, the average age of founders across all businesses worldwide is 42 years.
The average age of the founders for the top 0.1% of the highest-growing startups is 45 years old.
A 60-year-old startup founder is more likely to run a successful startup compared to a 30-year-old founder.
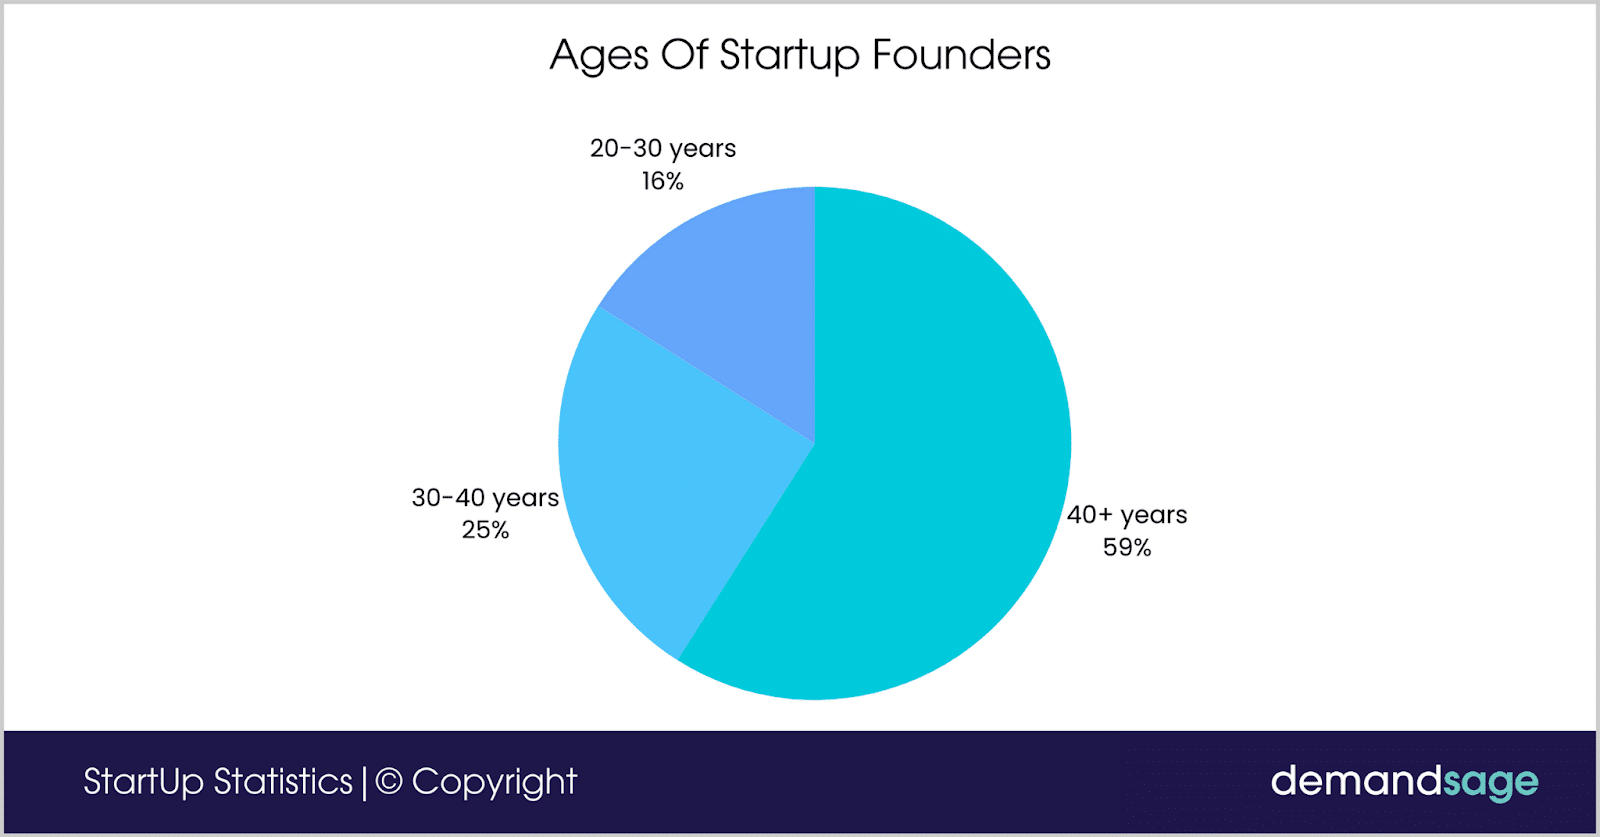
The following table displays the breakdown of the ages of startup founders worldwide.
| Age | Percentage Of Startup Founders |
|---|---|
| 40+ years | 59% |
| 30-40 years | 25% |
| 20-30 years | 16% |
Source: HBR.
64.3% Of The Founders Are Male, While 35.7% Are Female
The percentage of female founders was just 17.64% in 2020, and that of male founders was 82.36%.
It is impressive that the number of female founders has also increased over the past year, and the gender gap is decreasing with time.
The following table displays the percentage of male and female founders recorded over the years.
| Year | Percentage Of Male Founders | Percentage Of Female Founders |
|---|---|---|
| 2024 | 64.33% | 35.67% |
| 2020 | 82.36% | 17.64% |
| 2016 | 70.24% | 29.76% |
| 2013 | 78.84% | 21.16% |
| 2010 | 82.21% | 17.79% |
Source: Zippia.
With 62.8%, Most Of The Founders Worldwide Are White
Over 6 in 10 founders worldwide are white. Comparatively, in 2020, 75% of the startup founders worldwide were white.
16.9% of the startup founders are Hispanic or Latino. In contrast, just 0.9% of the American Indians and Alaska Natives are startup founders.
Here are further details about the race of startup founders worldwide.
- White: 62.8%
- Hispanic or Latino: 16.9%
- Black or African American: 10.8%
- Unknown: 4.9%
- Asian: 3.7%
- American Indian and Alaska Native: 0.9%
Source: Zippia.
71% Of Startup Founders Have Completed Just A Bachelor’s Degree
Nearly three-fourths of startup founders have just a bachelor’s degree. Meanwhile, 16% of the founders stated they had a master’s degree.
Just 3% of the founders worldwide own a doctorate.
The education level of a person does not make him a successful founder. However, a person’s experience and knowledge in the industry help a startup succeed.

The following table displays the educational qualifications of the startup founders.
| Degree | Percentage Of Startup Founders That |
|---|---|
| Bachelor’s | 71% |
| Master’s | 16% |
| Associate | 6% |
| Doctorate | 3% |
| Other Degrees | 4% |
Source: Zippia.
Startups By Industry
IT startups have the highest failure rate, at 63%.
At least 1 in 2 manufacturing businesses fail worldwide. Retail startups have a failure rate of 53%.
The following table displays the failure rate of startups recorded in different industries worldwide.
| Industry | Startup Failure Rate |
|---|---|
| Information | 63% |
| Transportation and utilities | 55% |
| Retail | 53% |
| Construction | 53% |
| Manufacturing | 51% |
| Mining | 49% |
| Wholesale | 46% |
| Services | 45% |
| Agriculture | 44% |
| Education and health | 44% |
| Financial insurance and real estate | 42% |
Source: Failory.
Fintech Startups
Here are further details about the fintech startups worldwide.
There Are around 30,000 Fintech Startups Worldwide
This number has been increasing constantly since 2019, when there were only around 12,000 fintech startups.
The United States produces the most value in fintech, with 242 unicorns in 2025.
Europe is in second place with 65 fintech unicorns, and India is in third place with 29.
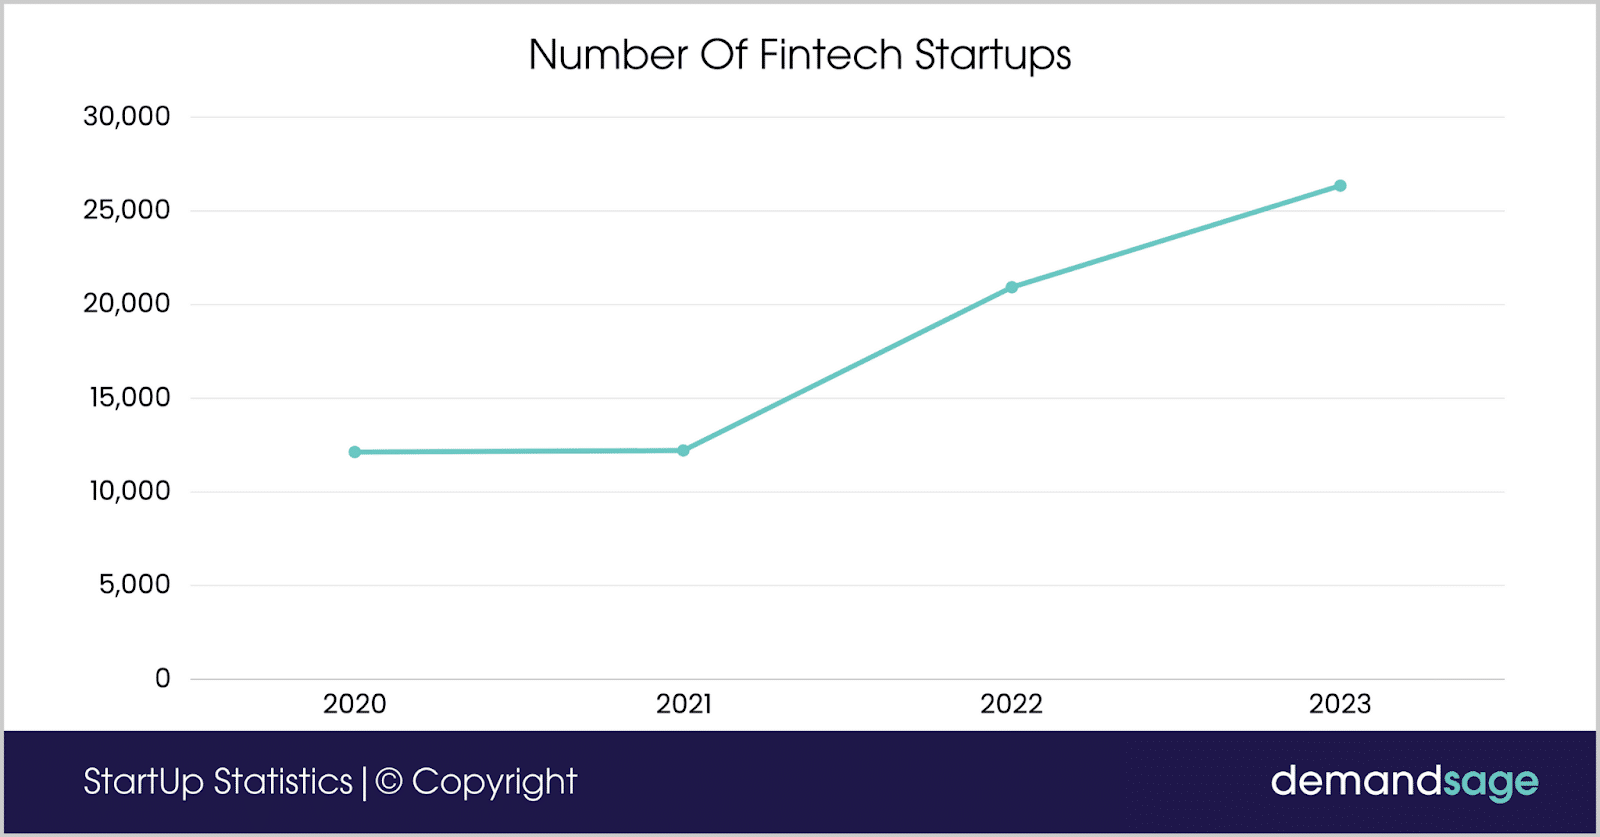
The following table displays the Fintech Startups recorded over the years.
| Year | Number Of Fintech Startups |
|---|---|
| 2020 | 12,131 |
| 2021 | 12,211 |
| 2022 | 20,925 |
| 2023 | 26,346 |
| 2024 | 29,955 |
There Are Over 13,100 Fintech Startups In The United States
This number has doubled since 2020, when only 5,686 fintech startups existed.
The fintech market in the United States is worth $4 trillion as of 2024 and is predicted to grow at a CAGR of 11% till 2028.
That means that the number of Fintech Startups in the US will also increase rapidly in the upcoming years.
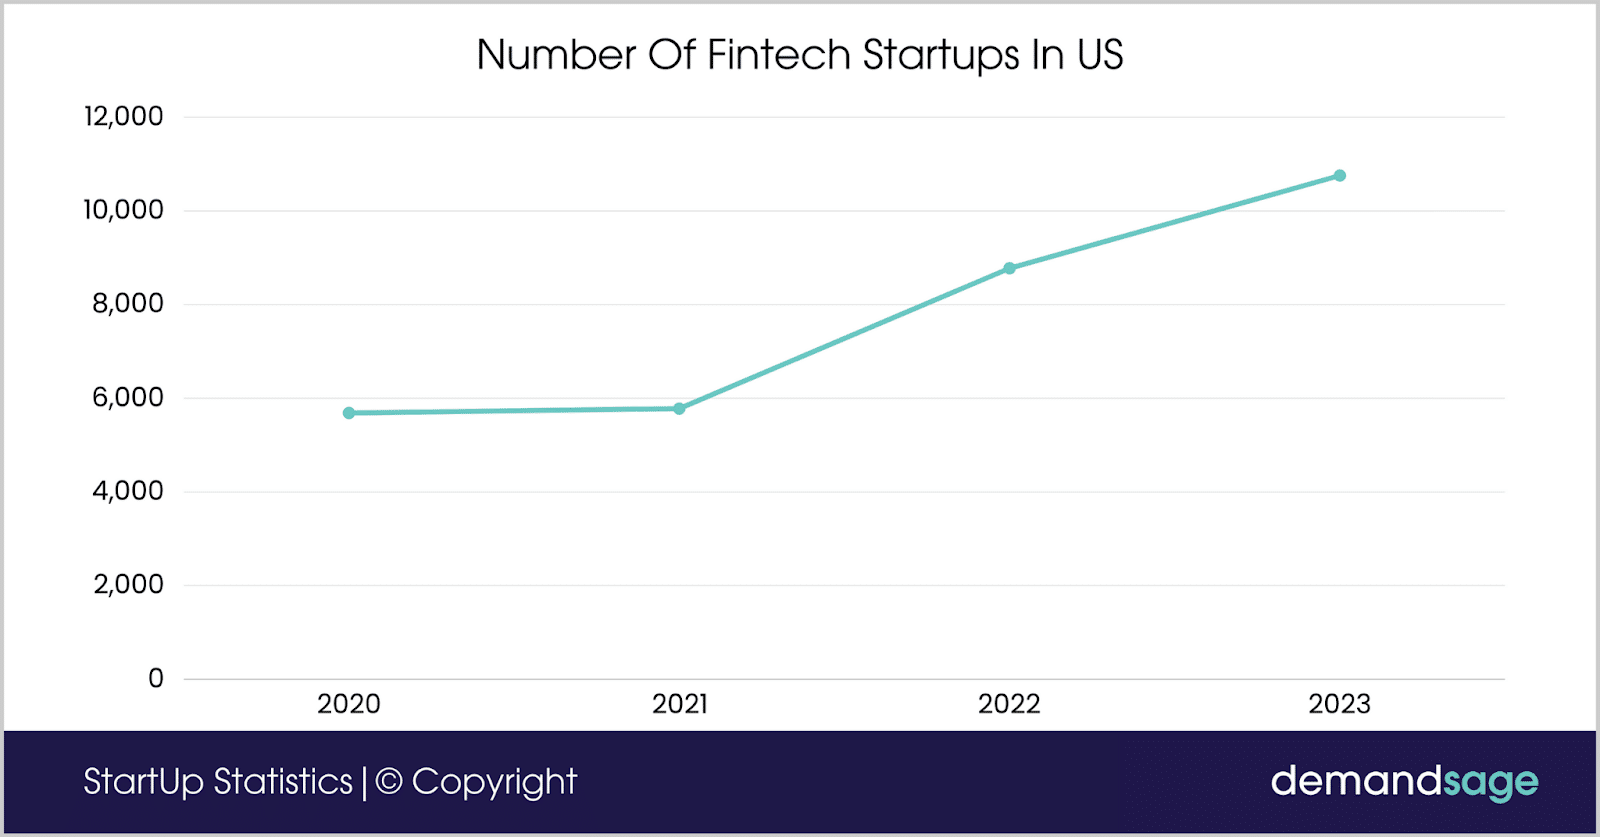
The following table displays the number of Startups recorded in the United States over the years.
| Year | Number Of Fintech Startups |
|---|---|
| 2020 | 5,686 |
| 2021 | 5,779 |
| 2022 | 8,775 |
| 2023 | 10,755 |
| 2024 | 13,100 |
Source: Mordor Intelligence, CFTE.
The Americas Is Home To 13,100 Fintech Startups, Making It The Region With The Highest Number
This marks a significant increase from 2023, when there were 11,651 fintech startups, and from 2021, when the number stood at 10,755. Notably, fintech startups in the APAC region grew by over 800, while the EMEA region saw an increase of more than 1,200 compared to 2023.
The following table displays the number of fintech startups in different regions.
| Region | 2021 | 2023 | 2024 |
|---|---|---|---|
| America | 10,755 | 11,651 | 13,100 |
| EMEA | 9,323 | 9,681 | 10,969 |
| APAC | 6,268 | 5,061 | 5,886 |
Source: Statista.
The Total Value Of Investments In Fintech Companies Was $210.6 billion In 2024
Investments in fintech companies increased drastically between 2010 and 2019, reaching $216.8 billion.
However, in the next year, the investments decreased. Later, in 2021, investments in fintech companies peaked at $229.6 billion.
Here is a table displaying further details about the total value of investments into fintech companies recorded over the years.
| Year | Total Value Of Investments In Fintech Companies ($) |
|---|---|
| 2024 | 210.6 billion |
| 2023 | 118.2 billion |
| 2022 | 197.9 billion |
| 2021 | 229.6 billion |
| 2020 | 123.3 billion |
| 2019 | 216.8 billion |
| 2018 | 148.6 billion |
| 2017 | 59.2 billion |
| 2016 | 73.7 billion |
| 2015 | 64.9 billion |
Source: Statista.
E-commerce Startups
E-commerce is one of the fastest-growing industries worldwide, with hundreds of startups being created every day.
This section covers details about e-commerce startups and businesses.
E-Commerce Businesses Have A Success Rate Of 10% To 20%
Most businesses fail within the first 120 days.
In North America, 70% of e-commerce startups fail within five years.
Most e-commerce businesses fail as they cannot understand their consumers’ needs. Some other reasons for e-commerce startup failure are a lack of market knowledge, no demand for products in the market, improper services, and more.
Source: Fit small business, The B2B house.
There Are More Than 26.5 Million E-Commerce Sites Worldwide
This is a significant increase from 9.2 million in 2019. The United States accounts for more than half of them.
According to the latest figures, there are nearly 14 million e-commerce sites in the United States, accounting for 53% of the e-commerce sites worldwide.
In comparison, the United Kingdom and Brazil are second and third, with 1.24 million and 730,000 e-commerce startups, respectively.
The following table displays the number of e-commerce startups recorded worldwide.
| Country | Number Of eCommerce Startups |
|---|---|
| United States | 13,980,000 |
| United Kingdom | 1,249,000 |
| Brazil | 730,000 |
| Germany | 720,000 |
| Australia | 650,000 |
| France | 570,000 |
| Russia | 555,000 |
| Italy | 490,000 |
| Canada | 470,000 |
| India | 430,000 |
Source: Digital Commerce 360.
Technology
The number of technology startups emerging daily has increased over the past few years. However, very few of them manage to stay in the market even for a year.
Let’s take a look at the statistics about technology startups in this section.
63% Of The Tech Businesses Fail Within Five Years
The failure rate of tech companies is relatively high compared to other industries.
Some of the major reasons for their failure are a lack of capital, poor products, inadequate funding, inexperienced teams, and ineffective leadership.
Every year, 20 tech companies are launched in the United States that will generate a revenue of $100 million.
Source: Forbes.
Startups in Healthcare
Establishing a startup in healthcare requires time, money, and patience. It will be a long run until your startup is based. But many business owners give up even before they get successful.
Here’s why!
90% Of Health Startups Fail
21.5% fail in the first year, while 30% fail in the second year. By the end of the 5th year, 50% of the medtech startups fail, and by the 10th year, 70% fail.
The major reason why health startups fail is the lack of market demand. Many startup owners fail to analyze the market and verify product demand. Hence, rushing to launch the product often leads to failure.
Source: LinkedIn.
There Are 51,900 Health Tech Startups In The United States
This number has grown rapidly in the past three years.
Healthcare startups have the potential to impact global health disparities significantly. Factors like poverty and socioeconomic conditions drive these disparities.
Source: Tracxn
Small Business Statistics
Small business startups usually run on a local level. They sell products that have demands in the local market and have a greater chance of being successful if they manage to identify the needs of their target audience.
82% Of Small Business Startups Fail Because of Cash Flow Mismanagement
More than 8 in 10 small businesses admit that they failed because they experienced cashflow problems.
A cash flow problem occurs when a business has more costs than income. That means the business doesn’t have enough to pay payroll or other operational expenses.
Source: Luisa Zhou.
Conclusion: There Are More Than 150 Million Startups Worldwide
The startup ecosystem is thriving, with more than 150 million startups around the world. The United States is at the forefront, home to 1.56 million of these innovative ventures.
Venture funding in 2025 totaled $425 billion, with AI startups attracting nearly $210 billion, representing 50% of the total funding.