
The average median annual salary in the US is $63,795, and the median weekly salary is $1,214. However, there’s more to this data that we need to understand.
This article breaks down U.S. income trends in 2026, including gender pay gaps, income differences by race, education, age, and state, and key insights into how earnings vary nationwide.
Average US Income 2026 (Editor’s Pick)
- The average annual income in the U.S. is $63,795, reflecting steady wage growth.
- Full-time workers earn a median weekly income of $1,214.
- Men earned $1,333 per week, whereas women earned $1,076, a pay gap of $257.
- Asian workers lead in earnings, with a median weekly income of $1,620.
- Massachusetts is the highest-paying state in the USA ($76,600 annual salary).
- Mississippi ranks as the lowest-paying state in the United States, with an average $43,100 salary.
What Is The Average Income In The U.S.?
The annual salary in the US is $63,795, highlighting approximately 2.92% increase compared to previous years when it was $62,192.
According to the Bureau of Labor Statistics, the average weekly median salary of full-time wage and salary workers in the USA is $1,214.
This is a 4.2% increase compared to the previous year (2024 at the same time).
Men (25 years and above) earn the highest at a 1,405 weekly median salary, whereas women earn $1,145.
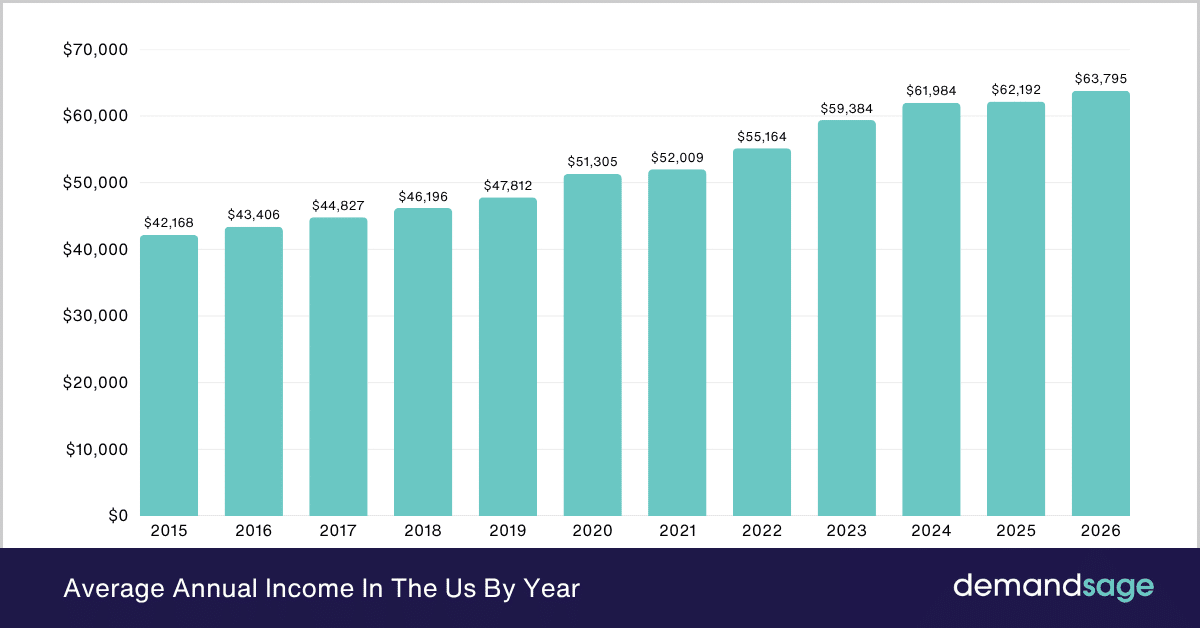
Here is a table displaying the average annual income in the US by year:
| Year | The Median Annual Income |
|---|---|
| 2026* | $63,795 |
| 2025 | $62,192 |
| 2024 | $61,984 |
| 2023 | $59,384 |
| 2022 | $55,164 |
| 2021 | $52,009 |
| 2020 | $51,305 |
| 2019 | $47,812 |
| 2018 | $46,196 |
| 2017 | $44,827 |
| 2016 | $43,406 |
| 2015 | $42,168 |
Note: This data shows earnings before taxes and deductions, including overtime, commissions, and tips (for the main job if working multiple jobs).
Source: US Bureau of Labor Statistics
Average Household Income In The US
The latest data shows that the average household income in the US is $87,730.

Compared to 2022, when the average household income was $79,500, it’s a 10.35% increase.
Besides, it’s worth noting that between the years 2023-2024, the median income increased by 5.5% for Hispanic households and 5.1% for asian households. However, the median income for the Black household declined by 3.3%.
For non-Hispanic and white households, the median income did not increase significantly either.
The following table displays the median household incomes in the United States recorded in 2022 and 2023 by race.
| Race | Average Household Income in 2022 | Average Household Income in 2023 |
|---|---|---|
| All races | $77.5K | $80.6K |
| White | $80.3K | $84.6K |
| White Non-Hispanic | $84.3K | $89.1K |
| Black | $55.0K | $56.5K |
| Asian | $113.1K | $112.8K |
| Hispanic (All races) | $65.3K | $65.5K |
Source: CNBC 1, CNBC 2.FRED, Census
Average U.S. Income By State
If we include all jurisdictions, Washington, D.C., ranks the highest. However, in the 50 states of the USA, Massachusetts currently has the highest average individual salary, up to $76,600.
New Jersey ranks as the second-highest paying state, with the average salary going up to $71,400.
The following table displays the states with the highest average salary in the United States.
| State | Median Household Income | Average Individual Salary (Est.) |
|---|---|---|
| Alabama | $60,786 | $54,700 |
| Alaska | $76,918 | $68,500 |
| Arizona | $70,919 | $61,200 |
| California | $76,190 | $73,200 |
| Colorado | $82,716 | $67,800 |
| Connecticut | $82,341 | $70,100 |
| Florida | $65,801 | $55,900 |
| Georgia | $62,401 | $58,300 |
| Illinois | $69,611 | $63,500 |
| Maryland | $82,646 | $69,800 |
| Massachusetts | $83,430 | $76,600 |
| Michigan | $63,994 | $57,400 |
| New Jersey | $84,257 | $71,400 |
| New York | $68,795 | $74,800 |
| North Carolina | $63,611 | $56,200 |
| Ohio | $62,952 | $55,100 |
| Pennsylvania | $67,676 | $58,500 |
| Texas | $63,448 | $61,200 |
| Virginia | $77,420 | $65,400 |
| Washington | $85,482 | $72,300 |
Mississippi ranks as the lowest-paying state in the United States, with the individual salary being an average of $43,100.
Followed by this state is Louisiana with an average individual salary of $48,600 and a median household income of $60,740 – $60,986.
Based on the data released by the U.S. Census Bureau and the Federal Reserve Economic data, here are the top 5 lowest-paying states of the USA:
| State | Median Household Income (2025 Release) | Avg. Individual Salary (Est.) |
|---|---|---|
| Mississippi | $55,980 – $59,127 | $43,100 |
| Louisiana | $60,740 – $60,986 | $48,600 |
| West Virginia | $63,150 – $60,798 | $47,200 |
| Arkansas | $64,840 – $62,106 | $46,500 |
| Kentucky | $64,790 – $64,526 | $49,100 |
Note: The range in “Median Household Income” reflects slight variations between the Census Bureau’s CPS ASEC reports and the ACS 1-Year estimates released in late 2025.
Sources: Census Bureau, Federal Reserve Bank
Average U.S. Income By Gender
When it comes to earnings in the U.S., income levels continue to vary by gender, reflecting differences in industry representation, work experience, and wage gaps.
In Q3 2025, men (aged 16 and above) earned $1,333 per week, whereas women (aged 16 and above) earned $1,076. This reflects a gender pay gap in the United States of $257 between the two.
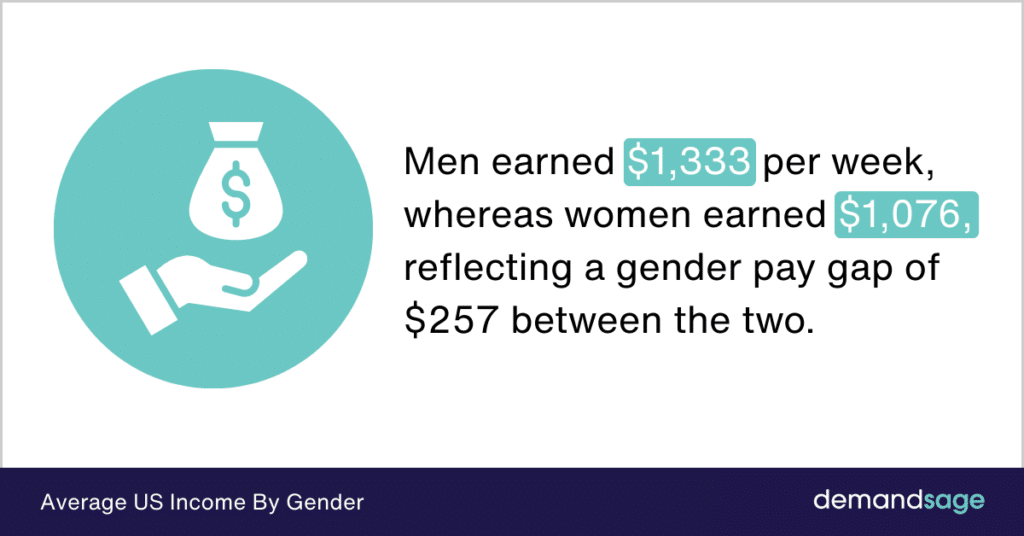
To put it in perspective, men earned around 23.88% more than women.
It’s also worth noting that the gender pay gap has not changed much compared to Q2 2025, where women earned $1,078 compared to men earning $1,330.
However, despite the continuous effort to reduce the gender pay gap, women continue to earn less than men.
Average Income In The U.S. By Age
Workers in the 35 to 44 age group earn the most, with a median weekly income of, $1,385 followed closely by those aged 45 to 54 ($1,377).
Young workers (16 to 19 years old) have the lowest earnings at $622 per week, as many are in entry-level jobs or working part-time.
Earnings increase significantly with age and experience, rising from $622 (16–19 years) to $1,150 (25–34 years), highlighting the impact of career progression and education on income levels.
| Age | Total ($) | Men ($) | Women ($) |
|---|---|---|---|
| 16 to 24 years | 771 | 802 | 715 |
| 25 to 34 years | 1,150 | 1,221 | 1,055 |
| 35 to 44 years | 1,385 | 1,504 | 1,226 |
| 45 to 54 years | 1,377 | 1,497 | 1,192 |
| 55 to 64 years | 1,322 | 1,481 | 1,103 |
| 65 years and over | 1,193 | 1,259 | 1,119 |
Source: U.S. Bureau of Labor Statistics
Sage Read: Interested in learning about the cities experiencing rapid growth in the United States? Check out our post on the Fastest-growing Cities in the U.S.
Average US Income By Race
Among major racial and ethnic groups in the U.S., Hispanic workers had the lowest median earnings, making $944 per week.
Black workers earned slightly more at $970 per week, while White workers had a higher median income of $1,238 per week. Asian workers earned the most, with a median weekly income of $1,620.
These differences in income reflect various factors, including education levels, industry representation, and access to higher-paying job opportunities. While progress has been made in closing wage gaps, disparities still exist across racial and ethnic groups.
| Race | Earnings Per Week |
|---|---|
| Hispanic | $944 |
| Black | $970 |
| White | $1,238 |
| Asian | $1,620 |
Source: U.S. Bureau of Labor Statistics
Average Income Of U.S. Families
US families with four people have the highest income, reaching $125,700 as of 2023.
Families that have two people have an annual income of $86,430, while families with seven people or more have a median income of $99,600.
Did you know? There are over 150 million startups globally, with the United States leading as the country with the highest number of startups.

The following table displays the median income in the United States by family size:
| Family Size | Annual Median Income |
|---|---|
| 2-people | $86,430 |
| 3-people | $107,100 |
| 4-people | $125,700 |
| 5-people | $115,400 |
| 6-people | $118,000 |
| 7 people or more | $99,600 |
Source: US Census Bureau.
Average U.S. Income By Education
Workers without a high school diploma earn the lowest wages, making around $750 per week.
Meanwhile, those with an advanced degree take home the highest pay at $1,912 per week.
Education continues to play a major role in boosting income. For example, workers holding a bachelor’s degree earn $1,559 weekly, which is nearly $600 more than high school graduates ($960).
Over the course of a year, this education gap translates into an income difference of over $30,000, showing us the long-term financial value of higher education.
The following table displays the median weekly earnings of US adults by education:
| Education | Median Weekly Income |
|---|---|
| Less than a High School Diploma | $750 |
| High school diploma | $960 |
| Some college, no degree | $1,086 |
| Associate’s degree | $1,066 |
| Bachelor’s degree | $1,559 |
| Master’s degree | $1,732 |
| Professional degree | $1,912 |
| Doctoral degree | $1,912 |
Source: U.S. Bureau of Labor Statistics
Important note: A lot of data is from 2023, and we have specified the year, too. It’s important to keep in mind that the latest data recorded for certain income levels were for 2024-2025. We keep this page updated as per the new data (as soon as it’s out).
Conclusion: Average Median Annual Income In The USA is $63,795
The average annual income in the U.S. is $63,795, a significant increase from 2025. However, wage disparities persist. Men working full-time earned a median weekly wage of $1,333, while women earned $1,076, highlighting that men make approximately 23.88% more than women in the USA.
The report also shows us the significance of education, where people with professional degrees earn $1,912, compared to $750 with less than a High School Diploma.
