
The branded merchandise is one of the cheapest marketing methods due to the fact that 87% of people keep promotional items for more than one year.
In addition, these statistics support this assumption: the global promotional products market is projected to grow from $97.42 billion in 2025 to $130.78 billion by 2033. Currently, healthcare companies invest the most in promotion, while the apparel industry leads in sales.
We have compiled a detailed statistical report covering market size, industry trends, consumer behavior, and product performance using data from credible third-party sources.
Key Promotional Products Statistics
- The global promotional products market was valued at $90.5 billion in 2023, projected to reach $130.8 billion by 2033.
- 87% of consumers keep promotional products for over a year.
- Healthcare leads promo product purchases at nearly a 20% share.
- Fleece/jackets generate the deepest impressions at 9,000 per item.
- Food gifts make 92% of recipients more likely to buy.
- 66% of promotional products eventually end up in landfill.
Global Promotional Products Industry Size
The global promotional products market was valued at approximately $90.5 billion in 2023 and is projected to reach $130.8 billion by 2033, growing at a CAGR of 3.75%.
In the United States alone, the promotional products industry reached $27.1 billion in 2025, surpassing the $27 billion mark for the first time and growing 1.3% over 2024. Based on that trajectory, the U.S. market is estimated to reach approximately $27.45 billion in 2026. North America holds the largest regional share, accounting for roughly 31% of global sales in 2025.
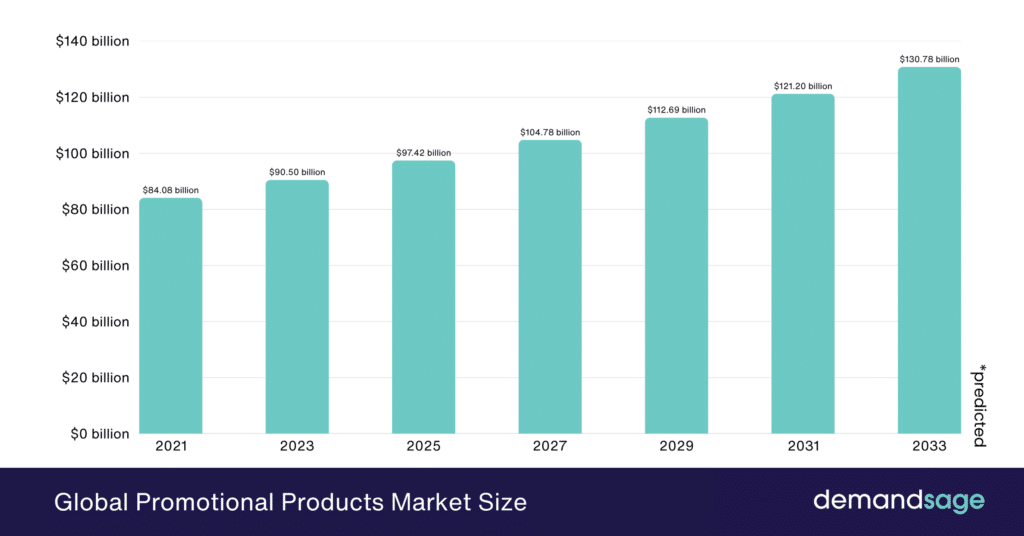
The following table displays the global promotional products market size by year:
| Year | Market Size |
|---|---|
| 2021 | $84.08 billion |
| 2023 | $90.50 billion |
| 2025 | $97.42 billion |
| 2027* | $104.78 billion |
| 2029* | $112.69 billion |
| 2031* | $121.20 billion |
| 2033* | $130.78 billion |
*projected
Source: Grand View Research, Cognitive Market Research, PPAI Sales Volume Report 2025, GiftAFeeling 2026 Report
Among all product categories, apparel continues to lead global sales. In the U.S., T-shirts are the top-selling promotional product with $4.2 billion in annual sales, followed by drinkware, which accounts for just over 10% of total industry revenue.
Promotional Product Longevity Statistics
87% of people keep promotional products for more than a year, and 40% keep them for more than 10 years.
Source: Sellers Commerce
Typically, the consumer keeps the promo item for an average duration of eight to sixteen months, allowing the product to remain visible long after being acquired.
Source: Print to Brand
Most customers keep the promotional product for one to five years; however, females usually keep the product up to ten years, while males may retain the product for eleven years or even more. The gender difference is important for selecting the right product category according to the target customers’ preferences.
Source: PPAI
57% of consumers who own promotional products report keeping some for more than 5 years, rising to 65% among Baby Boomers and 51% among Millennials.
Source: Steel City
Six dollars’ worth of the tote bag makes up to 5,000 touches, costing only 1/10 of a cent per impression.
78% of U.S. consumers say they keep promotional products because they find them useful, making utility the strongest predictor of retention.
Source: ASI
Products don’t stop working when a consumer is done with them. Roughly four in ten will pass promotional products on when they are done using them, with five in ten passing them on to someone else.
Source: PPAI
Promotional Products Statistics By Industry
Promotional product spending is not evenly distributed across sectors. A handful of industries account for the bulk of purchases, shaped by how frequently they interact with customers, employees and the public. The data below breaks down which industries invest the most in branded merchandise and what they tend to order.
Which Industries Buy The Most Promotional Products?
The health care sector represents the biggest purchaser of promo products, consuming almost 20% (19.92%) of total product sales.
The top 5 industries hold 75% of the total promo products purchase market.
The table below shows which industries are the largest buyers of promotional products.
| Industry | Percentage |
|---|---|
| Healthcare | 19.92% |
| Construction | 17.93% |
| Retail | 13.55% |
| Manufacturing | 12.35% |
| Financial | 11.95% |
| Education | 9.96% |
| Non-Profit / Not-For-Profit | 3.19% |
| Technology | 2.79% |
| Government | 1.59% |
| Energy, Utilities & Waste Treatment | 1.20% |
| Real Estate | 1.20% |
| Food & Beverage | 0.80% |
| Transportation | 0.80% |
| Agriculture | 0.40% |
| Oil & Gas | 0.40% |
| Fitness | 0.40% |
| Telecommunications | 0.40% |
| Entertainment | 0.40% |
| Recreation/Leisure | 0.40% |
| Recreation/Team Sports | 0.40% |
Source: Sage World
Best Promotional Products By Impressions
Fleece and jackets come in first place with 9,000 impressions, followed by bags with 4,900 impressions. This is roughly 46% fewer impressions than fleece and jackets, but still the second-highest category on the chart.
In reality, branded clothes account for 19,400 impressions (52%) because fleece, hats, T-shirts, and polos make up this number.
Utilitarian goods are popular among gadgets since health, safety, and umbrellas have higher impressions compared to power banks and USB drives (6,300 vs. 2,200).
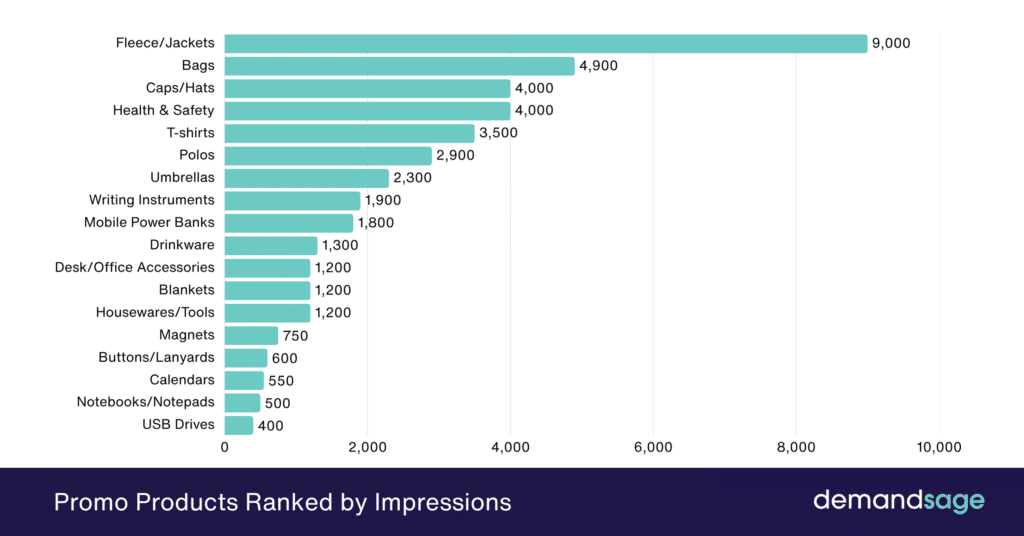
Here is how these products rank by lifetime impressions:
| Product Category | Impressions |
|---|---|
| Fleece/Jackets | 9,000 |
| Bags | 4,900 |
| Caps/Hats | 4,000 |
| Health & Safety | 4,000 |
| T-shirts | 3,500 |
| Polos | 2,900 |
| Umbrellas | 2,300 |
| Writing Instruments | 1,900 |
| Mobile Power Banks | 1,800 |
| Drinkware | 1,300 |
| Desk/Office Accessories | 1,200 |
| Blankets | 1,200 |
| Housewares/Tools | 1,200 |
| Magnets | 750 |
| Buttons/Lanyards | 600 |
| Calendars | 550 |
| Notebooks/Notepads | 500 |
| USB Drives | 400 |
Source: ASI
How Do People Receive Promotional Products
A little over half of people (52%) pick up promotional products directly from on-site displays, making it the single most common channel by a clear margin.
Beyond the top sources, there is a fairly even spread across several mid-level channels, with most between 20% and 28%.
Even the lowest category, “other” at 7.6%, is small compared to the rest, showing that almost all acquisition routes are fairly structured and repeatable rather than random.
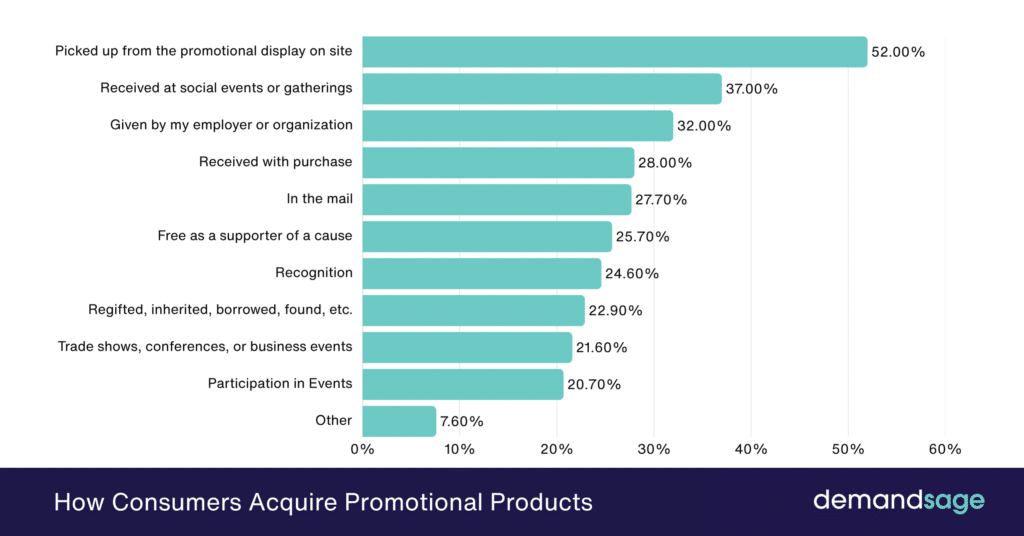
The following table breaks down how consumers most commonly acquire promotional products:
| How It Was Acquired | Share of users |
|---|---|
| Picked up from the promotional display on site | 52.00% |
| Received at social events or gatherings | 37.00% |
| Given by my employer or organization | 32.00% |
| Received with purchase | 28.00% |
| In the mail | 27.70% |
| Free as a supporter of a cause | 25.70% |
| Recognition | 24.60% |
| Regifted, inherited, borrowed, found, etc. | 22.90% |
| Trade shows, conferences, or business events | 21.60% |
| Participation in Events | 20.70% |
| Other | 7.60% |
Source: Sellers Commerce
Most Ordered Promotional Products
The top three types of most purchased promotional products include Apparel, which ranks first with 39%, followed by Office and Technology, which tie in second place with 38% and 37%, respectively.
The demand for everyday use products is high since products under Apparel, Office, Technology, Food and Beverage, Caps/Hats, and Bags/Travel rank higher than 30%.
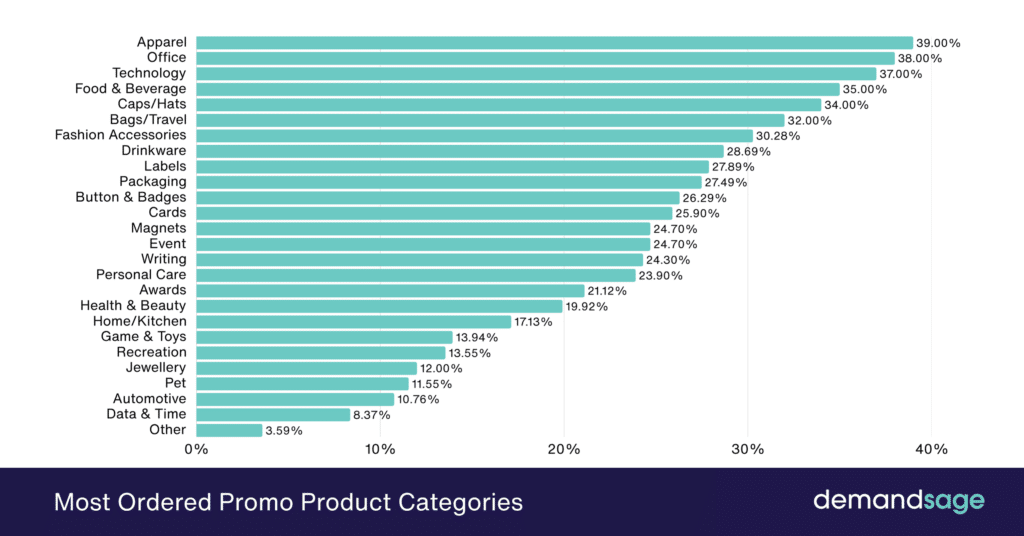
The table below shows the most ordered promotional product categories and their order share:
| Promotional Product Type | Percentage |
|---|---|
| Apparel | 39% |
| Office | 38% |
| Technology | 37% |
| Food & Beverage | 35% |
| Caps/Hats | 34% |
| Bags/Travel | 32% |
| Fashion Accessories | 30.28% |
| Drinkware | 28.69% |
| Labels | 27.89% |
| Packaging | 27.49% |
| Button & Badges | 26.29% |
| Cards | 25.90% |
| Magnets | 24.70% |
| Event | 24.70% |
| Writing | 24.30% |
| Personal Care | 23.90% |
| Awards | 21.12% |
| Health & Beauty | 19.92% |
| Home/Kitchen | 17.13% |
| Game & Toys | 13.94% |
| Recreation | 13.55% |
| Jewellery | 12% |
| Pet | 11.55% |
| Automotive | 10.76% |
| Data & Time | 8.37% |
| Other | 3.59% |
Source: Sage World
Online sales of promotional products reached $7.1 billion in 2025, accounting for 26.3% of total industry revenue. Distributors under $2.5 million in annual revenue reported 11.4% online sales growth.
Source: PPAI
Top Metrics For Measuring Promotional Product Success
Customer retention is the most popular measure at 60.16%.
Lead generation is the least popular measure at 34.26%, indicating that people consider promotional products more valuable for improving relations with their customers and increasing brand awareness rather than acquiring new leads.
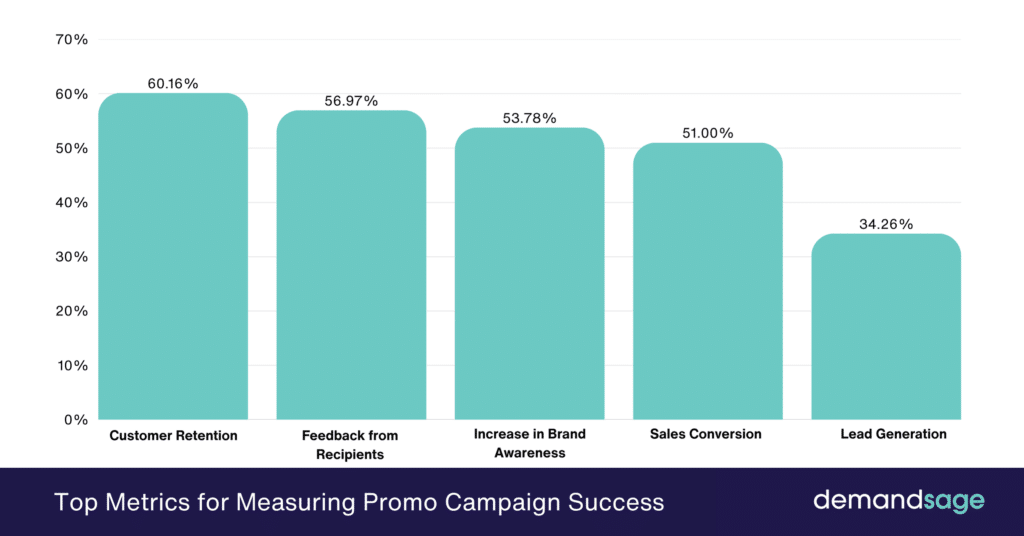
Here is a table displaying how businesses measure the success of their promotional product campaigns:
| Measurement Metric | Percentage |
|---|---|
| Customer Retention | 60.16% |
| Feedback from Recipients | 56.97% |
| Increase in Brand Awareness | 53.78% |
| Sales Conversion | 51.00% |
| Lead Generation | 34.26% |
Source: Sage World
How Do Consumers Respond to Promotional Products?
Food gifts are the clear standout, with 94% of recipients saying they are more likely to do business with the brand.
Moreover, even the least liked promotional items make a difference, with magnets (63%) and calendars (64%) influencing almost two-thirds of recipients.
The table below presents data on how receiving different promotional items affects purchase decisions:
| Product Received | More Likely to Do Business (%) |
|---|---|
| Food Gifts | 94% |
| Blankets | 87% |
| Fleece/Jackets | 83% |
| Desk Accessories | 83% |
| Health & Safety | 82% |
| Power Banks | 81% |
| Housewares/Tools | 79% |
| Writing Instruments | 77% |
| Bags | 77% |
| Umbrellas | 76% |
| Notebooks | 75% |
| Drinkware | 74% |
| Headwear | 72% |
| Polos | 72% |
| USB Drives | 71% |
| T-Shirts | 69% |
| Buttons/Lanyards/Stickers | 67% |
| Calendars | 64% |
| Magnets | 63% |
Source: ASI
76% of U.S. consumers say they are more likely to do business with a brand that provides them with promotional merchandise.
Wearable products generate the most excitement, with T-shirts (55%) and fleece/jackets (52%) leading all categories, showing a strong preference for items people can use regularly.
In contrast to this, magnets (20%) and buttons/lanyards/stickers (11%) come last on the list, which shows that recipients get more enthusiastic about things that have more utility.
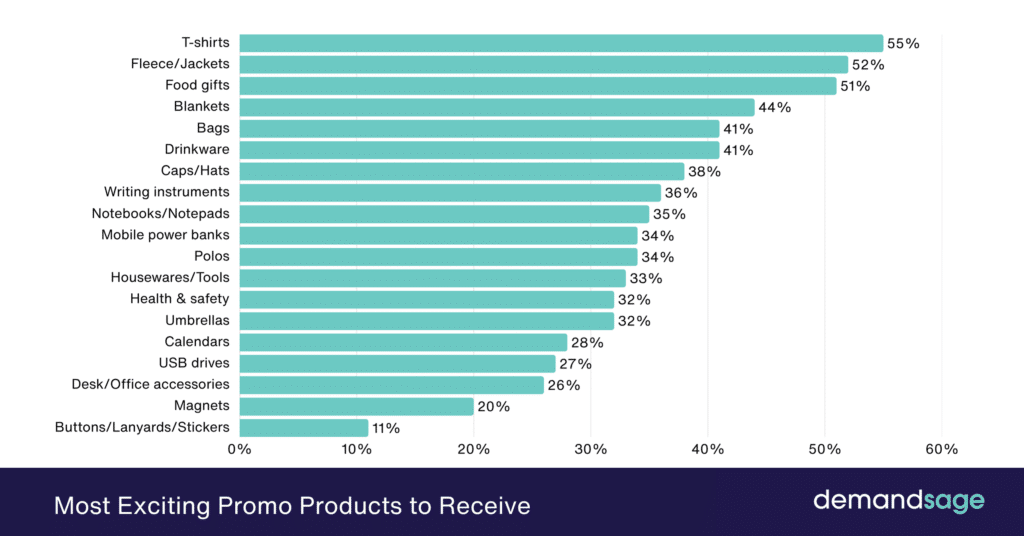
The table below highlights which promotional products consumers are most excited to receive:
| Product Category | Percentage |
|---|---|
| T-shirts | 55% |
| Fleece/Jackets | 52% |
| Food gifts | 51% |
| Blankets | 44% |
| Bags | 41% |
| Drinkware | 41% |
| Caps/Hats | 38% |
| Writing instruments | 36% |
| Notebooks/Notepads | 35% |
| Mobile power banks | 34% |
| Polos | 34% |
| Housewares/Tools | 33% |
| Health & safety | 32% |
| Umbrellas | 32% |
| Calendars | 28% |
| USB drives | 27% |
| Desk/Office accessories | 26% |
| Magnets | 20% |
| Buttons/Lanyards/Stickers | 11% |
Source: ASI
Read other reports:
Promotional Products Challenges Statistics
66% of promotional products eventually end up in landfill, with 40% discarded immediately after being received.
Source: Gift A Feeling
Nearly 90% of distributors raised their prices during 2025, with an average increase of 11%, driven primarily by higher import costs from China, India, and other key supply chain sources.
Source: PR Newswire
Distributors reported average sales declines of 3.6% in Q1 and 3.2% in Q2 of 2025, with small and mid-sized distributors hit hardest, with the overall quarterly drop marking the worst retreat since the COVID-19 impact in Q1 2021.
Source: ASI Central, PPAI
