
As of 2026, Amazon continues to dominate the global e-commerce and cloud market, holding a 37.8% U.S. market share. Additionally, Amazon generated $181.5 billion in revenue in Q1 2026.
With over 250 million Prime members and 2.28 billion website visits, Amazon’s user base and reach remain unmatched.
Our report breaks down Amazon’s latest statistics, including sales, traffic, user behavior, AWS growth, advertising performance, and global revenue trends.
Amazon Statistics 2026: Top Picks
- Amazon ranks #4 globally in brand value, worth $1.02 trillion.
- Amazon holds 37.8% of the U.S. e-commerce market.
- Amazon’s Q1 2026 net revenue hit $181.5 billion.
- Amazon’s ad revenue is projected to hit $94 billion by 2026
- AWS is Amazon’s fastest-growing venture, earning $37.6 billion in Q1 2026 with a 28% YoY increase.
- In 2025, Amazon Prime membership crossed 250 million.
- Amazon.com had 2.28 billion visits in June 2026
- Amazon processes 18.5 orders per second, shipping over 20-25 million packages daily.
Amazon Market Share
- Amazon holds 37.8% of the U.S. e-commerce market, making it the leading platform in the US eCommerce industry.
- At the same time, Walmart and Apple own just 6.3% and 3.9% shares of the US ecommerce market.
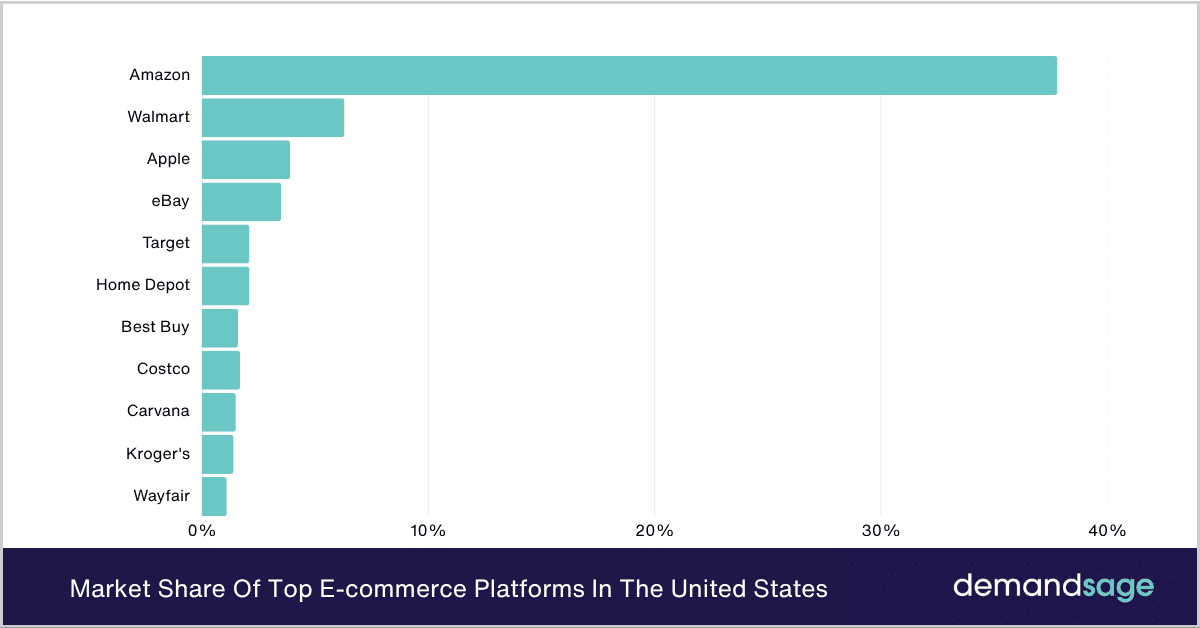
- Here is a table displaying the market share of the top e-commerce platforms in the United States.
| E-Commerce Platform | Percentage Of Market Share |
|---|---|
| Amazon | 37.80% |
| Walmart | 6.30% |
| Apple | 3.90% |
| eBay | 3.50% |
| Target | 2.10% |
| Home Depot | 2.10% |
| Best Buy | 1.60% |
| Costco | 1.69% |
| Carvana | 1.50% |
| Kroger’s | 1.40% |
| Wayfair | 1.10% |
Source: Business of Apps
Amazon Market Share & Brand Value
- As of 2026, Amazon is the 4th most valuable brand in the world, with a brand value of $1.02 trillion.
Here is a breakdown of the most valuable brands in the world compared to Amazon:
| Brand | 2026 Value |
|---|---|
| $1.48 trillion | |
| Apple | $1.38 trillion |
| Microsoft | $1.11 trillion |
| Amazon | $1.02 trillion |
| NVIDIA | $814.9 billion |
| $366.6 billion | |
| $286.2 billion | |
| Tencent | $251.6 billion |
| Oracle | $235.8 billion |
| McDonald’s | $235.1 billion |
Source: Kantar
Amazon Revenue Statistics
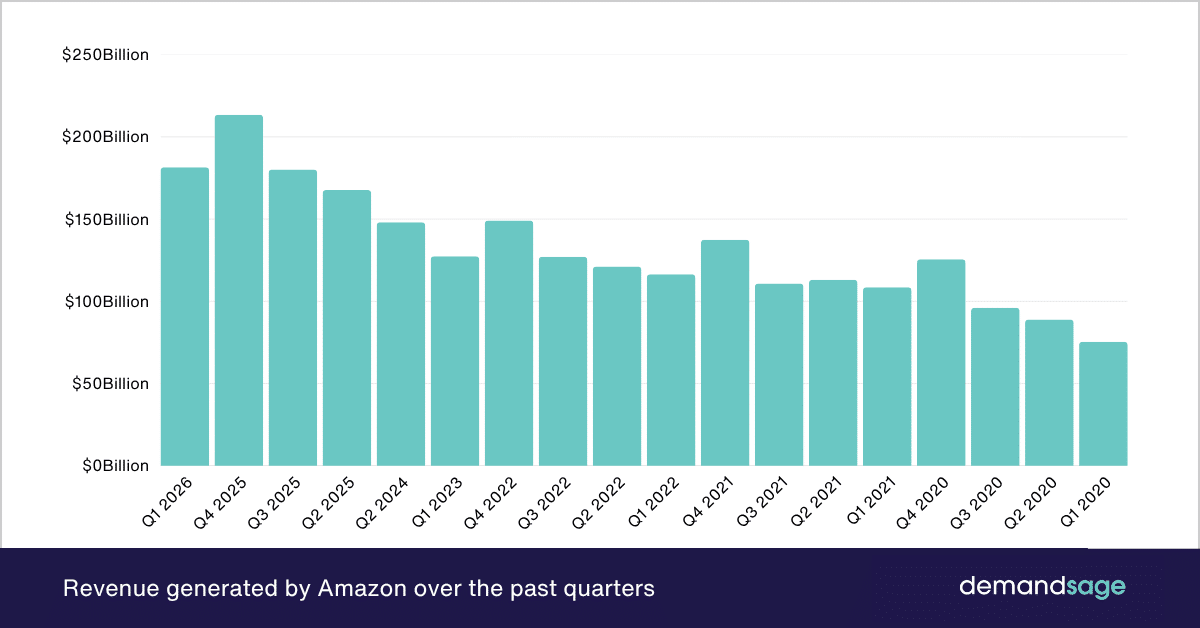
- Amazon’s total net sales reached $181.5 billion in Q1 2026, showing a 15% year-over-year (YoY) growth from $155.7 billion in Q1 2025.
- Excluding foreign exchange impacts, Amazon’s revenue rose by 11%.
- The Trailing Twelve Months (TTM) revenue stood at $742.77 billion, up 3.61% YoY.
- The following table displays the net sales revenue generated by Amazon over the past quarters.
| Quarter | Net Sales Revenue |
|---|---|
| Q1 2026 | $181.5 billion |
| Q4 2025 | $213.4 billion |
| Q3 2025 | $180.2 billion |
| Q2 2025 | $167.7 billion |
| Q2 2024 | $148 billion |
| Q1 2023 | $127.4 billion |
| Q4 2022 | $149.2 billion |
| Q3 2022 | $127.1 billion |
| Q2 2022 | $121.23 billion |
| Q1 2022 | $116.44 billion |
| Q4 2021 | $137.41 billion |
| Q3 2021 | $110.81 billion |
| Q2 2021 | $113.08 billion |
| Q1 2021 | $108.52 billion |
| Q4 2020 | $125.56 billion |
| Q3 2020 | $96.15 billion |
| Q2 2020 | $88.91 billion |
| Q1 2020 | $75.45 billion |
Source: Statista, Companies Market Cap, Amazon Investor
Amazon Revenue by Segment And Region
- As of 2025, Amazon’s North America segment was the largest contributor to Amazon’s revenue, making up to 60% of its total revenue.
- North America generated $104.1 billion in Q1 2026, while AWS delivered the highest YoY growth of 28%.
Here is a quick breakdown of Amazon revenue by segment in Q2 2025.
| Segment | Q1 2026 Sales (B) | Q1 2025 Sales (B) | YoY Growth | Share of Total Revenue |
|---|---|---|---|---|
| North America | $104.1 | $92.9 | 12% | 57.4% |
| International | $39.8 | $33.5 | 19% | 21.9% |
| AWS | $37.6 | $29.3 | 28% | 20.7% |
- Amazon’s online store sales grew to $64.3 billion, and AWS showed the strongest YoY growth at 28%, reaching $37.6 billion in Q1 2026.
| Business Line | Q1 2025 ($B) | Q1 2026 ($B) | Growth % |
|---|---|---|---|
| Online Stores | $57.4 | $64.3 | 12% |
| Third-party Seller Services | $36.5 | $41.6 | 14% |
| AWS | $29.3 | $37.6 | 28% |
| Advertising Services | $13.9 | $17.2 | 24% |
| Subscription Services | $11.7 | $13.4 | 15% |
| Physical Stores | $5.5 | $5.8 | 5% |
| Other | $1.3 | $1.6 | 25% |
- In Q1 2026, Amazon’s net product sales totaled $71.3 billion, while net service sales reached $110.2 billion, reflecting a stronger 20% YoY growth in services.
| Category | Q1 2025 (B) | Q2 2026 (B) | YoY Growth |
|---|---|---|---|
| Net Product Sales | $63.9 | $71.3 | 11.58% |
| Net Service Sales | $91.6 | $110.2 | 20.31% |
- In the first half of 2025 (H1), Amazon recorded $323.4 billion in net sales, up from $291.3 billion in H1 2024. This shows an 11% YoY increase.
| Metric | H1 2025 (B) | H1 2024 (B) | YoY Growth |
|---|---|---|---|
| Total Net Sales | $323.4 | $291.3 | 11% |
| Net Product Sales | $132.2 | $122.5 | 8% |
| Net Service Sales | $191.2 | $168.8 | 13% |
- Amazon’s quarterly revenue has consistently exceeded $140 billion since Q1 2024, peaking at $213.4 billion in Q4 2025.
| Quarter | Total Sales (B) | YoY Growth |
|---|---|---|
| Q1 2024 | $143.3 | 13% |
| Q2 2024 | $148.0 | 10% |
| Q3 2024 | $158.9 | 11% |
| Q4 2024 | $187.8 | 11% |
| Q1 2025 | $155.7 | 9% |
| Q2 2025 | $167.7 | 13% |
| Q3 2025 | $180.2 | 13% |
| Q4 2025 | $213.4 | 14% |
| Q1 2026 | $181.5 | 17% |
- In terms of growth rates by segment (excluding FX* impact), AWS led with a steady 17% growth in both Q2 and Q1 2025, while North America grew by 11% in Q2 2025.
| Segment | Q1 2026 |
|---|---|
| North America | 8% |
| International | 5% |
| AWS | 17% |
*FX Impact: Foreign Exchange Impact
Source: About Amazon, Amazon Q1 2025, Amazon Q1 2026
- Amazon revenue peaked in 2025 when it generated net sales of $716.9 billion.
- There was an increase of 12.38% in the revenue generated by the platform in 2022 compared to the previous year. Besides, the net sales revenue generated increased from $637.9 billion in 2024 to almost $716.9 billion in 2025.

The following table displays the net sales revenue generated by Amazon over the past years.
| Year | Net Revenue Generated By Amazon |
|---|---|
| 2025 | $719.9 billion |
| 2024 | $637.9 billion |
| 2023 | $574.7 billion |
| 2022 | $513.98 billion |
| 2021 | $469.82 billion |
| 2020 | $386.06 billion |
| 2019 | $280.52 billion |
| 2018 | $232.89 billion |
| 2017 | $177.87 billion |
| 2016 | $135.99 billion |
| 2015 | $107.01 billion |
| 2014 | $88.99 billion |
| 2013 | $74.45 billion |
Source: Statista, Amazon 2024, 2025, 2026
Amazon Traffic Statistics
- As of May 2026, Amazon.com received 2.28 billion visits, ranking #13 globally.
- Amazon ranks #5 in the United States and #9 in the Online Services category.
- Being a top-performing site, Amazon’s traffic increased by 10% from April 2026
- Most of Amazon’s traffic came from direct visits, standing at 66.54%.
Here are the top traffic sources to Amazon:
| Source | Share |
|---|---|
| Direct | 66.54% |
| Google organic (google.com) | 15.09% |
| mail.google.com | 1.36% |
| Youtube.com | 1.32% |
| Primevideo.com | 0.97% |
- Amazon users spent an average of 11 minutes 35 seconds per session and visited 7.11 pages per visit.
- Amazon.com’s traffic was driven largely by mobile users (57.55%), while desktop traffic accounted for 42.45%.
- The United States accounted for the vast majority of Amazon’s traffic, representing over 82.41% of all visits.
Here is the breakdown of Amazon traffic by country:
| Country | Traffic Share | All devices | Desktop | Mobile |
|---|---|---|---|---|
| United States | 82.41% | 1.88B | 40.23% | 59.77% |
| India | 1.91% | 43.46M | 33.55% | 66.45% |
| Canada | 0.86% | 19.59M | 47.59% | 52.41% |
| Germany | 0.80% | 18.24M | 54.47% | 45.53% |
| United Kingdom | 0.78% | 17.7M | 53.35% | 46.65% |
Source: Semrush
How Many People Use Amazon?
- Amazon Prime grew from 46 million users in 2016 to 250 million as of today, which is a 5x increase in just 8 years.
- Let us take a look at Amazon users for different products and services they provide for the year 2025-2026:
| Service Category | Users (2024–2025) |
|---|---|
| Amazon E-commerce* | ~500 million |
| Amazon Prime* | 260 million |
| Prime Video* | 240 million |
| Prime Music | 82 million |
| AWS (Cloud Users) | ~10–15 million accounts |
| Kindle/E-book Users | ~50–70 million |
*Please note that most Prime users are also active e-commerce shoppers and Prime Video viewers, hence there could be an overlap in their numbers.
- Approximately 90% of shoppers in the US and UK actively use Amazon, with Amazon monthly active user estimates ranging from 300 to 600 million globally.
Source: Amazon Financial Report, Business of Apps
- As of 2025, Amazon.com recorded 2.56 billion global visits, suggesting that Amazon’s monthly active user base consists of 320 to 427 million users.
- Amazon daily active users (DAU) range between 48 million and 107 million, depending on sales and days.
- Considering the inactive accounts included, the Amazon user base likely totals between 800 million and 1.28 billion globally.
- The United States alone accounts for over 83% of Amazon’s traffic, which translates to 8 out of every 10 visitors for Amazon being from the USA.
- This means the US has a huge number of people using Amazon every month, somewhere between 266 million and 355 million.
Source: Semrush
While Amazon doesn’t publicly disclose the exact total number of user accounts regularly, we can make a strong data-backed estimate based on the traffic data.
Amazon Sales Statistics
- Amazon has over 1.9 million active sellers and 9,7 million total registered Seller Central accounts.
- 62% of all products sold on Amazon came from third-party sellers (independent businesses using Amazon’s platform).
- Third-party sellers now account for 60% of all sales on Amazon.
- Alternatively, the remaining 38% of sales were directly handled by Amazon itself (Amazon-owned inventory).
- In 2025, 350+ million different products will be available on Amazon, the majority of which will be sold by third-party sellers.
- Nearly 50% of U.S. sellers use FBA, and 300,000+ sellers have used MCF since it launched.
Source: Amazon Supply Chain, About Amazon, Sum Tracker
Amazon Prime Day Sales Statistics
- U.S. consumers spent $24.1 billion online during the Amazon Prime Day sale (July 8–11, 2025), marking a 30.3% YoY increase, more than double the sales of Black Friday 2024 ($10.8 billion).
- In 2025, Mobile shopping dominated the Prime Day sale, accounting for 53.2% of total online sales, up from 49.2% in 2024
- It was also observed during the Prime Day sales in 2025 that traffic from AI-powered tools surged 3,300% YoY as consumers used chatbots to find deals and product details.
- Influencer marketing played a key role as it drove 19.9% of total Amazon sales during this period.
- When it comes to sales, it is observed that influencers drive 10x more sales than the traditional method of social media marketing.
Source: Business Adobe
Amazon Statistics 2026: In Depth
45. There are 1,556,000 (full-time and part-time) working at Amazon.
46. Amazon generated nearly $716.9 billion in global net sales revenue as per the latest reports.
47. 50% of all units sold are distributed via Amazon’s FBA program.
Did you know Amazon grabbed the 2nd position in the Fortune 500 list of companies? You can read the list of all the companies that are at the top here.
48. There were almost 2 million sellers on the platform worldwide as of 2023. Of these, almost 1.1 million sellers are from the United States.
49. Amazon ships 20-25 million packages per day. (Red Stag)
50. Breaking down the numbers, Amazon processes almost 18.5 orders per second on average. However, these numbers do not include the packages of items fulfilled by merchants or the multiple orders shipped together.
Amazon Product Statistics: AWS Sales Revenue
51. Amazon Web Services generated $37.58 billion in the first quarter of 2026.
52. Comparatively, the AWS sales generated in Q1 of 2025 were $29.26 billion.
The following table displays the AWS net sales revenue generated over the past quarters.
| Quarter | AWS Net Sales Revenue |
|---|---|
| Q1 2026 | $37.587 billion |
| Q4 2025 | $35.579 billion |
| Q3 2025 | $33.006 billion |
| Q2 2025 | $30.873 billion |
| Q1 2025 | $29.267 billion |
| Q4 2024 | $28.786 billion |
| Q3 2024 | $27.452 billion |
| Q2 2024 | $26.281 billion |
| Q1 2024 | $25.037 billion |
| Q4 2023 | $24.204 billion |
| Q3 2023 | $23.059 billion |
| Q2 2023 | $22.140 billion |
| Q1 2023 | $21.4 billion |
| Q4 2022 | $21.3 billion |
| Q3 2022 | $20.5 billion |
| Q2 2022 | $19.7 billion |
| Q1 2022 | $18.4 billion |
53. AWS’s net sales generated annual revenue of $128.7 billion in 2025.
54. Comparatively, in 2024, it generated $107.6 billion in revenue. In the year 2023, $90.8 billion was generated by AWS.
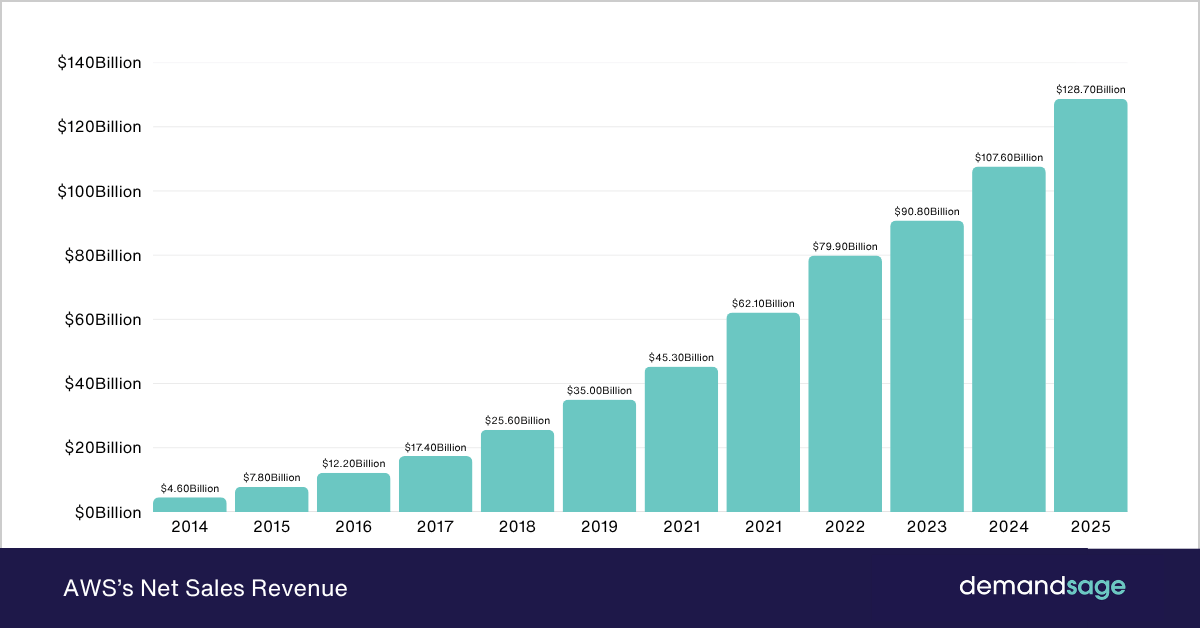
Here are the details about the net sales revenue generated by AWS in the past years.
| Year | AWS’s Net Sales Revenue |
|---|---|
| 2025 | $128.7 billion |
| 2024 | $107.6 billion |
| 2023 | $90.8 billion |
| 2022 | $79.9 billion |
| 2021 | $62.1 billion |
| 2020 | $45.3 billion |
| 2019 | $35 billion |
| 2018 | $25.6 billion |
| 2017 | $17.4 billion |
| 2016 | $12.2 billion |
| 2015 | $7.8 billion |
| 2014 | $4.6 billion |
Amazon Subscription Revenue
55. Amazon generated a revenue of $49.61 billion through Annual subscriptions in 2025.
56. The revenue generated by Amazon subscriptions is recorded to be more than $10 billion over the past three years. In 2024, Amazon generated $44.3 billion in revenue, while in 2023 it generated $40.2 billion from subscriptions.
The following table displays the revenue generated by Amazon over the past years.
| Year | Revenue Generated By Amazon Subscriptions |
|---|---|
| 2025 | $49.61 billion |
| 2024 | $44.3 billion |
| 2023 | $40.2 billion |
| 2022 | $35.2 billion |
| 2021 | $31.7 billion |
| 2020 | $25.2 billion |
| 2019 | $19.2 billion |
| 2018 | $14.1 billion |
| 2017 | $9.7 billion |
| 2016 | $6.3 billion |
| 2015 | $4.4 billion |
| 2014 | $2.7 billion |
Source: Amazon.
Do you know: You can become an Amazon FBA seller too. Use Helium 10 Coupon and find all the offers to make your Amazon selling journey easier.
Amazon Advertising Revenue
57. Amazon Ads is projected to reach $94 billion in global ad revenue by 2026, up from $37.74 billion in 2022.
58. In the U.S. alone, Amazon ad revenue is expected to grow from $27 billion in 2022 to $64 billion by 2026.
Source: Sales Duo
59. The advertisements on Amazon are run in-store and have been able to generate decent revenue over the past years. It managed to generate $56.2 billion in 2024 and $46.9 billion in 2023 through advertising on the platform.
Here is a table displaying the revenue generated by Advertising over the past years.
| Year | Revenue Generated By Amazon Advertising |
|---|---|
| 2025 | $68.6 billion |
| 2024 | $56.2 billion |
| 2023 | $46.9 billion |
| 2022 | $37.7 billion |
| 2021 | $31.1 billion |
| 2020 | $15.5 billion |
Amazon Loss & Profit Analysis
60. Amazon achieved a record-breaking $77.7 billion profit in 2025 and significantly increased its profit margins.
61. As of 2026, Amazon reported a net income of $30.3 billion in Q1 2026, showing a 77.19% increase compared to the same quarter last year.
62. It is important to note that despite high income, Amazon’s free cash flow dropped from $38 billion to $11 billion due to heavy capital investments ($50.7 billion), mostly in infrastructure and equipment.
Source: Amazon Financial Report
63. Back in the first quarter of 2023, Amazon generated a profit of $3.17 billion.
64. Comparatively, in the fourth quarter of 2022, Amazon generated a profit of $ 278 million. In the first quarter of 2022, Amazon reported a loss of $3.84 billion.
The following table displays the profit generated by Amazon in the past quarters.
| Quarter | Profit Generated By Amazon |
|---|---|
| Q4 2025 | 21,192 million |
| Q3 2025 | 21,187 million |
| Q2 2025 | 18,164 million |
| Q1 2025 | 17,127 million |
| Q4 2024 | 20,004 million |
| Q3 2024 | 15,328 million |
| Q2 2024 | 13,485 million |
| Q1 2024 | 10,431 million |
| Q4 2023 | 10,624 million |
| Q3 2023 | 9,879 million |
| Q2 2023 | 6,750 million |
| Q1 2023 | 3,172 million |
| Q4 2022 | 278 million |
| Q3 2023 | 2,872 million |
| Q2 2023 | -2,028 million |
| Q1 2022 | -3,844 million |
Source: Business of Apps.
65. In the year 2022, Amazon had to face a loss of $2.72 billion.
66. The profit of Amazon went down from $ 33.36 billion in 20201 to -$2.72 billion in 2022. This was a huge loss compared to the past years. The highest loss faced by Amazon before this was $0.27 million in the year 2013.
The following table displays the profit and loss faced by Amazon over the past years.
| Year | Profit/ Loss |
|---|---|
| 2025 | $77.6 billion |
| 2024 | $59.2 billion |
| 2023 | $30.4 billion |
| 2022 | -$2.72 billion |
| 2021 | $33.36 billion |
| 2020 | $21.33 billion |
| 2019 | $11.58 billion |
| 2018 | $10.07 billion |
| 2017 | $3.03 billion |
| 2016 | $2.37 billion |
| 2015 | $0.59 billion |
| 2014 | -$0.24 billion |
| 2013 | -$0.27 billion |
Source: Business of Apps.
Amazon Ecommerce Revenue
67. Amazon generated total e-commerce revenue of $147.9 billion in Q2 2025, excluding AWS.
68. In Q2 of 2025 alone, Amazon’s e-commerce revenue was $121.7 billion, reflecting a 21.5% year-over-year increase.
69. The e-commerce segment made up 88.2% of Amazon’s total revenue in Q2 2025.
70. By the end of 2024, Amazon’s e-commerce operations generated over $520 billion annually, making it the largest e-commerce platform globally.
The following table displays the net sales of e-commerce made by Amazon.com over the past few years:
| Year | E-Commerce Net Sales of Amazon.com |
|---|---|
| 2025 (Q2 only) | $147.9 billion |
| 2024 | $520+ billion (estimated full year) |
| 2022 | $142.43 billion |
| 2021 | $131.01 billion |
| 2020 | $120.90 billion |
| 2019 | $86.02 billion |
| 2018 | $74.53 billion |
| 2017 | $66.95 billion |
| 2016 | $56.45 billion |
| 2015 | $47.26 billion |
| 2014 | $39.30 billion |
71. Additionally, Net service sales hit $99.5 billion in Q2 2025, representing 59.3% of e-commerce revenue, versus 40.7% for product sales.
72. International e-commerce revenue reached $36.8 billion, up 16% YoY, outpacing North America’s 11% YoY growth.
73. But in 2025, shipping costs increased 6% YoY to $23.4 billion, while fulfillment expenses rose 10.2% YoY to $26.0 billion for Amazon as per their official report.
74. Amazon’s US e-commerce market share remains dominant at 35%+, far ahead of its closest competitors.
Source: Statista, Amazon Financial Report
Amazon Revenue By Country
75. Amazon generated the highest net sales in the United States in 2022.
76. Amazon generated net sales of $356.113 billion in the United States as of 2022. Compared with the United Kingdom, it generated $30.07 billion.
Let me provide you with details on Amazon’s net sales by region worldwide over the past few years.
| Country | 2025 | 2024 | 2023 | 2022 | 2021 | 2020 |
|---|---|---|---|---|---|---|
| United States | $489.657 billion | $438.015 billion | $395.637 billion | $356.113 billion | $314.006 billion | $263.520 billion |
| Germany | $45.900 billion | $40.856 billion | $37.588 billion | $33.598 billion | $37.326 billion | $29.565 billion |
| United Kingdom | $43.212 billion | $37.855 billion | $33.591 billion | $30.074 billion | $31.914 billion | $26.483 billion |
| Japan | $30.688 billion | $27.401 billion | $26.002 billion | $24.396 billion | $23.071 billion | $20.461 billion |
| Rest of world | $107.467 billion | $93.832 billion | $81.967 billion | $69.802 billion | $63.505 billion | $46.035 billion |
Source: Amazon.
Amazon Physical Stores Vs Online Stores
77. In Q1 2026, Amazon generated $64.25 billion from online store sales compared to $5.78 billion from physical stores*.
78. Amazon’s online stores generate over 10x the revenue of physical stores.
79. The online-to-physical revenue ratio for Amazon stores looks like 11.48:1.
80. Online store revenue grew 11% YoY, while physical store revenue increased 7% YoY, with online sales contributing 36.7% of total revenue and physical stores contributing only 3.3%.
Here’s the breakdown of Amazon’s online-to-physical revenue in 2024 and 2025:
| Quarter | Online Stores | Physical Stores |
|---|---|---|
| Q1 2024 | $54.670B | $5.202B |
| Q2 2024 | $55.392B | $5.206B |
| Q3 2024 | $61.411B | $5.228B |
| Q4 2024 | $75.556B | $5.579B |
| Q1 2025 | $57.407B | $5.533B |
| Q2 2025 | $61.485B | $5.595B |
| Q3 2025 | $67.407B | $5.578B |
| Q4 2025 | $82.988B | $5.855B |
| Q1 2026 | $64.254B | $5.785B |
*Clarification: According to Amazon’s official definition, physical store revenue includes only products physically selected in-store. Online orders picked up at stores are included under “Online stores.”
Source: Amazon Financial Report
Amazon Acquisitions List
81. As of 2025, Amazon has made 109 acquisitions.
82. The most Amazon acquisitions happened during the years 2015 and 2017.
83. One of the most expensive acquisitions made by Amazon is Whole Foods.
84. Amazon acquired Whole Foods in 2017. It paid $13.7 billion for its acquisition. The second most expensive acquisition made by Amazon was Metro-Goldwyn-Mayer. They paid 8.450 billion for this acquisition.
Let us take a look at the list of the most expensive company acquisitions made by Amazon over the past few years.
| Acquisition Made By Amazon | Year | Acquisition |
|---|---|---|
| Whole Foods | 2017 | 13,700 |
| Metro-Goldwyn-Mayer | 2021 | 8,450 |
| One Medical | 2022 | 3,900 |
| Zoox | 2020 | 1,300 |
| Zappos | 2009 | 1,200 |
| Ring | 2018 | 1,200 |
| Pillpack | 2018 | 1,000 |
| Twitch | 2014 | 970 |
| Kiva Systems | 2012 | 775 |
| Souq.com | 2017 | 580 |
| Quidsi | 2011 | 500 |
Source: Statista, Tracxn
Amazon Users’ Habits & Customer Behavior
85. More than 65% of Amazon consumers shop through their desktops.
86. According to Statista, 64.9% of the people who shop on Amazon use the desktop to make purchases. At the same time, 16.6% of the consumers reported shopping through the mobile website, and 13.6% said they used the Amazon shopping app.
87. Electronics are the most frequently bought products on Amazon.
88. Almost 44% of shoppers choose to buy electronics from Amazon. Besides, 43% of shoppers prefer buying items such as clothes, shoes, and jewelry on the platform.
Below is a breakdown of the most frequently bought products from Amazon.
| Products | Percentage Of Consumers |
|---|---|
| Electronics | 44% |
| Clothing, shoes, and jewelry | 43% |
| Home and Kitchen | 39% |
| Beauty and personal care | 36% |
| Books | 33% |
| Cell phones and accessories | 28% |
| Movie and TV | 25% |
| Pet supplies | 20% |
89. 80% of people shop from Amazon due to the fast and free shipping.
90. Amazon offers a wide range of services to its users. This provides various reasons for shoppers to choose Amazon over other e-commerce platforms.
However, according to Statista, 80% of shoppers prefer Amazon for its shipping services, while 69% prefer it because they can choose from a wide range of products.
The following table displays the top reasons shoppers prefer Amazon over other platforms.
| Reasons | Percentage Of Shoppers |
|---|---|
| Fast and free shipping | 80% |
| Desire to use Prime membership | 66% |
| Wide selection of products | 69% |
| Best prices on products | 49% |
| Easy returns | 44% |
Source: Statista.
91. Approximately 66% of consumers search on Amazon for a new product they wish to buy.
92. Almost 90% of Americans prefer to buy from Amazon compared to other platforms. At the same time, around 7 out of 10 consumers said that they started to search for their new purchases on Amazon.
The following table displays the platforms where consumers start to search for their new purchases.
| Platform | Percentage Of Consumers |
|---|---|
| Amazon | 66% |
| Search Engine | 20% |
| Brand Website | 4% |
| Retailer Website | 4% |
| Other marketplaces | 3% |
| Social media | 1% |
| Other | 1% |
93. Amazon sales increased by 476% in Italy during the Black Friday sales in 2022.
94. Comparatively, Amazon sales increased by 440% in Germany and just by 269% in the United Kingdom during the Black Friday sales.
