
Android has 3.9 billion users and 68% global market share. Android surpassed 1 billion users just one year after launch and continues to thrive in regions like India, Brazil, and Indonesia, where it holds over 85% market share.
In the US, Android holds 41.71% of the mobile OS market, while Android 14 dominates version usage at 24.51%. Samsung leads the Android vendor space with 22.91% share, followed by Xiaomi. The Google Play Store currently hosts 2.06 million apps, with Instagram as the most downloaded.
In this article, I discuss these details and more. Let us get right into it.
Android Statistics 2026: At A Glance
- There are 3.9 billion Android OS users in the world.
- Android captures 68% of the mobile OS market.
- Android holds a 38.46% market share of the US mobile OS market.
- Over 21.7% of the Android version market share is owned by Android 16.
- Samsung dominates the Android mobile vendor market, holding a 31.5% market share.
How Many Android Users Are There?
More than 3.9 billion people worldwide use Android currently.
Android was initially launched in 2008, but the operating system rolled out in 2011. After the first year of Android OS rollout, the number of users reached 500 million in 2012 and crossed the 1 billion mark in 2014.

The following table displays the number of Android users worldwide.
| Year | The Number Of Android Users Per Year |
|---|---|
| 2012 | 0.5 billion |
| 2013 | 0.7 billion |
| 2014 | 1 billion |
| 2015 | 1.4 billion |
| 2016 | 1.7 billion |
| 2017 | 2 billion |
| 2018 | 2.3 billion |
| 2019 | 2.5 billion |
| 2020 | 2.8 billion |
| 2021 | 3 billion |
| 2022 | 3.3 billion |
| 2023 | 3.5 billion |
| 2024 | 3.6 billion |
| 2025 | 3.9 billion |
Source: Business of Apps, AppMySite
Android became the most popular mobile operating system in 2014. Within one year of its launch, it reached 1 billion users worldwide.
Android OS Market Share
68% of mobile phones use the Android operating system.
The following table displays the percentage of phones that use different operating systems.
| Operating System | Percentage Of Mobile Devices |
|---|---|
| Android | 68% |
| iOS | 31.94% |
| Unknown | 0.03% |
| Linux | 0.01% |
| KaiOS | 0.01% |
| Windows | 0.01% |
Source: StatCounter.
- Android has a market share of more than 85% in Brazil, India, Indonesia, Vietnam, and Turkey.
- India leads with 95.21% Android penetration, Indonesia follows at 86.8%, and Asia-Pacific overall shows 82.03% Android market share. China maintains 77.85% Android share despite Google’s absence.
Android Vs. iOS Market Share Worldwide
Android has a nearly 68% share of the mobile operating system market worldwide, while the iPhone holds a 31.94% share.
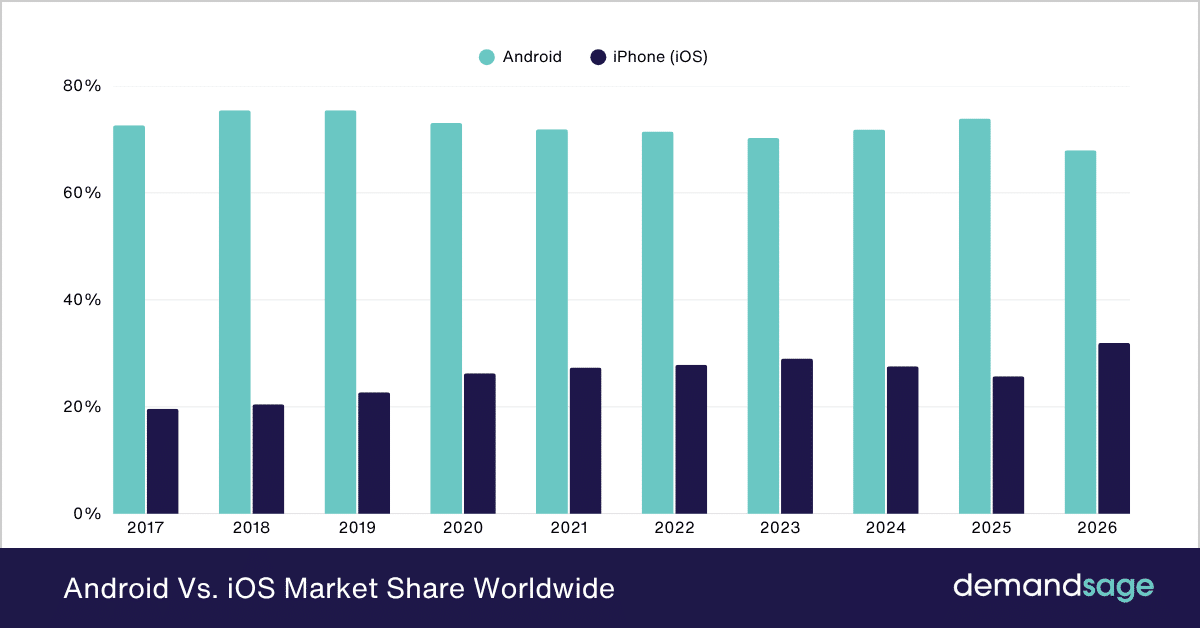
Here is a table displaying the mobile operating system market share owned by Android and iPhone by year:
| Year | Android | iPhone (iOS) |
|---|---|---|
| 2026 | 68% | 31.94% |
| 2025 | 72.55% | 27.04% |
| 2024 | 71.85% | 27.6% |
| 2023 | 70.26% | 29.02% |
| 2022 | 71.47% | 27.85% |
| 2021 | 71.89% | 27.34% |
| 2020 | 73.06% | 26.28% |
| 2019 | 75.47% | 22.71% |
| 2018 | 75.45% | 20.47% |
| 2017 | 72.63% | 19.65% |
Source: StatCounter
Android Market Share US
Android has a market share of 38.46% in the United States. Meanwhile, iPhones have a market share of 61.51%.
Here is a table displaying the market share of Android Vs iPhone in the United States.
| Year | Android | iPhone (iOS) |
|---|---|---|
| 2026 | 38.46% | 61.51% |
| 2025 | 41.71% | 58.03% |
| 2024 | 42.34% | 57.39% |
| 2023 | 41.46% | 58.1% |
| 2022 | 42.94% | 56.74% |
| 2021 | 41.11% | 58.58% |
| 2020 | 40.27% | 59.54% |
| 2019 | 44.51% | 55.23% |
| 2018 | 44.73% | 54.82% |
| 2017 | 45.23% | 53.89% |
| 2016 | 45.2% | 53.19% |
Source: StatCounter.
Android Vendor Market Share
With 31.5% of the mobile vendor market share, Samsung is the leading Android vendor worldwide.
Xiaomi follows Samsung with 15.9% of the market share.
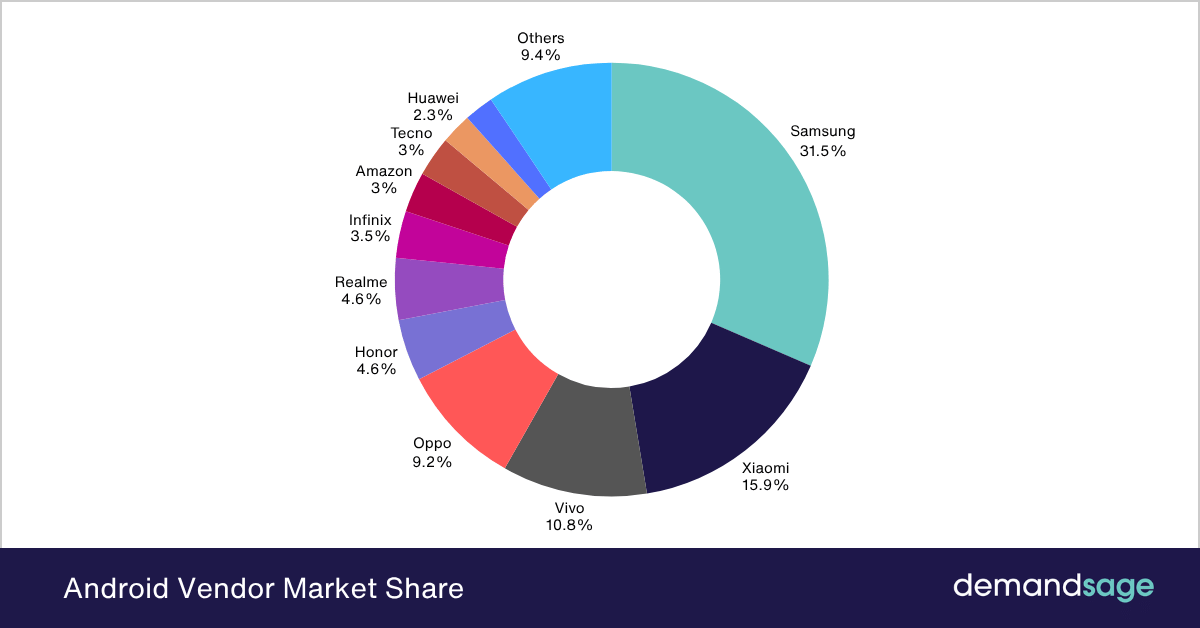
The following table displays the market share of the Android vendor market.
| Company | Market Share |
|---|---|
| Samsung | 31.5% |
| Xiaomi | 15.9% |
| Vivo | 10.8% |
| Oppo | 9.2% |
| Honor | 4.6% |
| Realme | 4.6% |
| Infinix | 3.5% |
| Amazon | 3.0% |
| Tecno | 3.0% |
| Huawei | 2.3% |
| Motorola | 2.2% |
| Others | 9.4% |
Source: AppBrain
Android Apps
As of June 2026, 2.36 million apps are available in the Google Play Store.
The following table displays the number of apps available on the Google Play Store over the years:
| Month, Year | Number of Apps On Google Play Store |
|---|---|
| Q1 2026 | 2,362,588 |
| Q2 2025 | 2,066,588 |
| Q2 2024 | 1,682,635 |
| Q1 2024 | 2,000,247 |
| Q4 2023 | 2,438,553 |
| Q3 2023 | 2,593,870 |
| Q2 2023 | 2,597,819 |
| Q1 2023 | 2,673,292 |
| Q4 2022 | 2,694,114 |
| Q3 2022 | 2,683,925 |
| Q2 2022 | 2,654,747 |
| Q1 2022 | 2,591,578 |
Source: Statista, 42Matters
Out of all the apps available on the Google Play store, Instagram with 584 million downloads is the most downloaded app worldwide. Meanwhile, TikTok has 446 million, and Facebook has 411 million downloads, which are second and third, respectively.
The following table displays the number of leading Android apps in the Google Play Store worldwide (last recorded in December 2024).
| Application | Number Of Application Downloads |
|---|---|
| 584 million | |
| TikTok | 446 million |
| 411 million | |
| 371 million | |
| Telegram | 245 million |
| WhatsApp Business | 202 million |
| Temu | 191 million |
| Snapchat | 154 million |
| Threads | 136 million |
| CapCut | 130 million |
Source: DesignRush
ChatGPT pulled 727M downloads on Android alone in 2025, roughly double its iOS downloads. This is a major shift in the app landscape worth noting.
Source: Udonis
Conclusion: Android Holds 68% Of The Global Mobile Os Market Share
Android continues to dominate mobile usage in 2026, with 3.9 billion users, a 68% global share, and a leading presence across major markets. Its 38.46% share in the US reflects strong competition with iOS, while in emerging markets, Android’s grip exceeds 85%.
Samsung remains the top Android brand, and over 2.36 million apps enrich the platform, led by Instagram and TikTok in downloads.
Android’s rapid rise since 2012 and steady annual growth confirm its unmatched reach in the smartphone ecosystem. As app numbers and user engagement grow, Android stays ahead as the most widely used mobile OS worldwide.
