According to Statista, 5.35 billion people use the internet worldwide as of 2024, accounting for 66.04% of the global population.
With over 1.05 billion users, China has the highest number of internet users. India and the United States follow with 729 million and 692 million internet users, respectively.
Several factors drive the growth of internet users, including the increasing affordability of smartphones and mobile data and the growing popularity of online services such as e-commerce, streaming video, and social media.
This post has some interesting insights on the number of internet users globally. Let us take a look at them below:
Top Internet User Statistics 2024
- As per Statista, there are 5.35 billion internet users in the world.
- 66.04% of the world’s population uses the internet.
- The number of internet users is expected to reach 6.54 billion by 2025.
- China has the highest number of internet users, 1.05 billion, followed by India, with 692 million, and the United States, with 311 million, according to Statista.
- As per What’s the Big Data, 92.1% of internet users primarily use smartphones to browse the internet.
- With 97.6%, Northern Europe has the highest internet penetration rate in the world, according to Statista.
- The global reach of social media has grown to 5.04 billion people, per Statista’s data.
- On average, internet users spend 6 hours and 40 minutes online daily. (Statista)
- According to Similarweb, 65.89% of the world’s web traffic is from mobile phone users.
How Many People Use The Internet?
- 5.35 billion people globally use the internet as of April 2024.
That is equivalent to 66.04% of the global population.
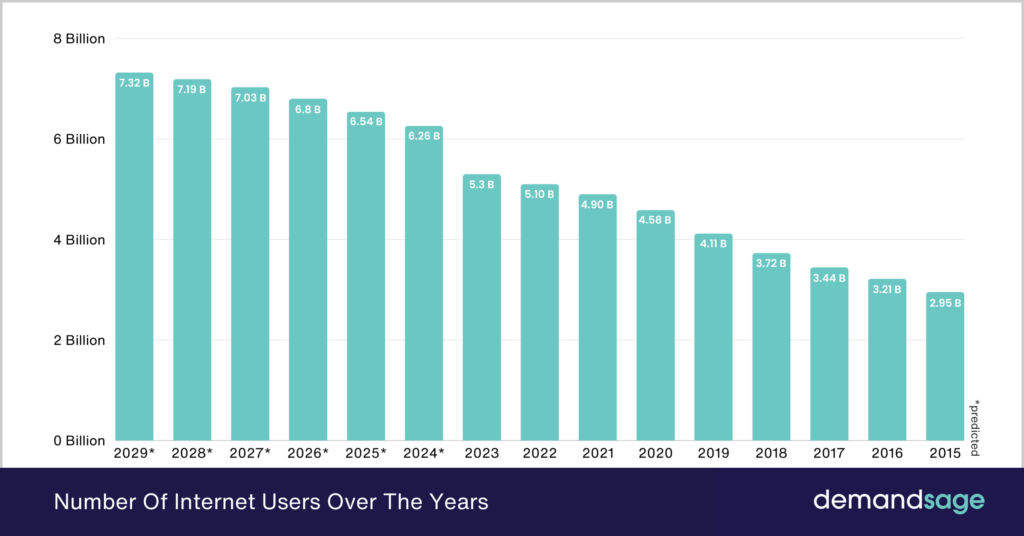
Further, internet users are anticipated to reach 6.26 billion by the end of 2024.
Besides, It is estimated that the number of people using the internet will cross the 7.32 billion mark by 2029.

Let’s take a look at the number of internet users over the years:
| Year | Number of Internet Users |
|---|---|
| 2029* | 7.32 billion |
| 2028* | 7.19 billion |
| 2027* | 7.03 billion |
| 2026* | 6.8 billion |
| 2025* | 6.54 billion |
| 2024* | 6.26 billion |
| 2023 | 5.3 billion |
| 2022 | 5.10 billion |
| 2021 | 4.901 billion |
| 2020 | 4.585 billion |
| 2019 | 4.119 billion |
| 2018 | 3.729 billion |
| 2017 | 3.444 billion |
| 2016 | 3.217 billion |
| 2015 | 2.954 billion |
- Share of the world’s population on the Internet
As per the latest data, 66.04% of the global population is accessing the internet on a regular basis. This number has grown by 25% in the last decade.
Here is a table showing the share of the global population using the Internet over the years:
| Year | Share of Global Population Using The Internet |
|---|---|
| 2024 | 66.04% |
| 2023 | 65.40% |
| 2022 | 63.10% |
| 2021 | 53.70% |
| 2020 | 52.40% |
| 2019 | 50.80% |
| 2018 | 48.90% |
| 2017 | 46.80% |
| 2016 | 44.60% |
| 2015 | 43% |
| 2014 | 40.70% |
- It is expected that there will be 27.1 billion networked devices in 2024.
- Google Chrome (63.39%) has the largest share among browsers.
- Apple’s Safari owns 21.04% of the market share of browsers.
- Internet usage increased by 1355% from the beginning of 2000.
- Currently, there are 370.7 million domain names in the world, and the U.S. has 135.2 million registered domains.
- 45% of the websites prefer WordPress as their CMS; It accounts for over 38.359 million websites.
- 361.6 billion emails are exchanged every day in 2024.
Here is a table showing the number of emails exchanged per day over the years:
| Year | Number of Emails Exchanged |
|---|---|
| 2026* | 392.5 billion |
| 2025* | 376.4 billion |
| 2024* | 361.6 billion |
| 2023 | 347.3 billion |
| 2022 | 333.2 billion |
| 2021 | 319.6 billion |
| 2020 | 306.4 billion |
| 2019 | 293.6 billion |
| 2018 | 281.1 billion |
| 2017 | 269 billion |
Source: Statista *Projected numbers
- The average loading speed of a website in the United States was found to be 5-6 seconds in every industry.
- It was reported that more than 1.5 million songs are streamed on Spotify every minute.
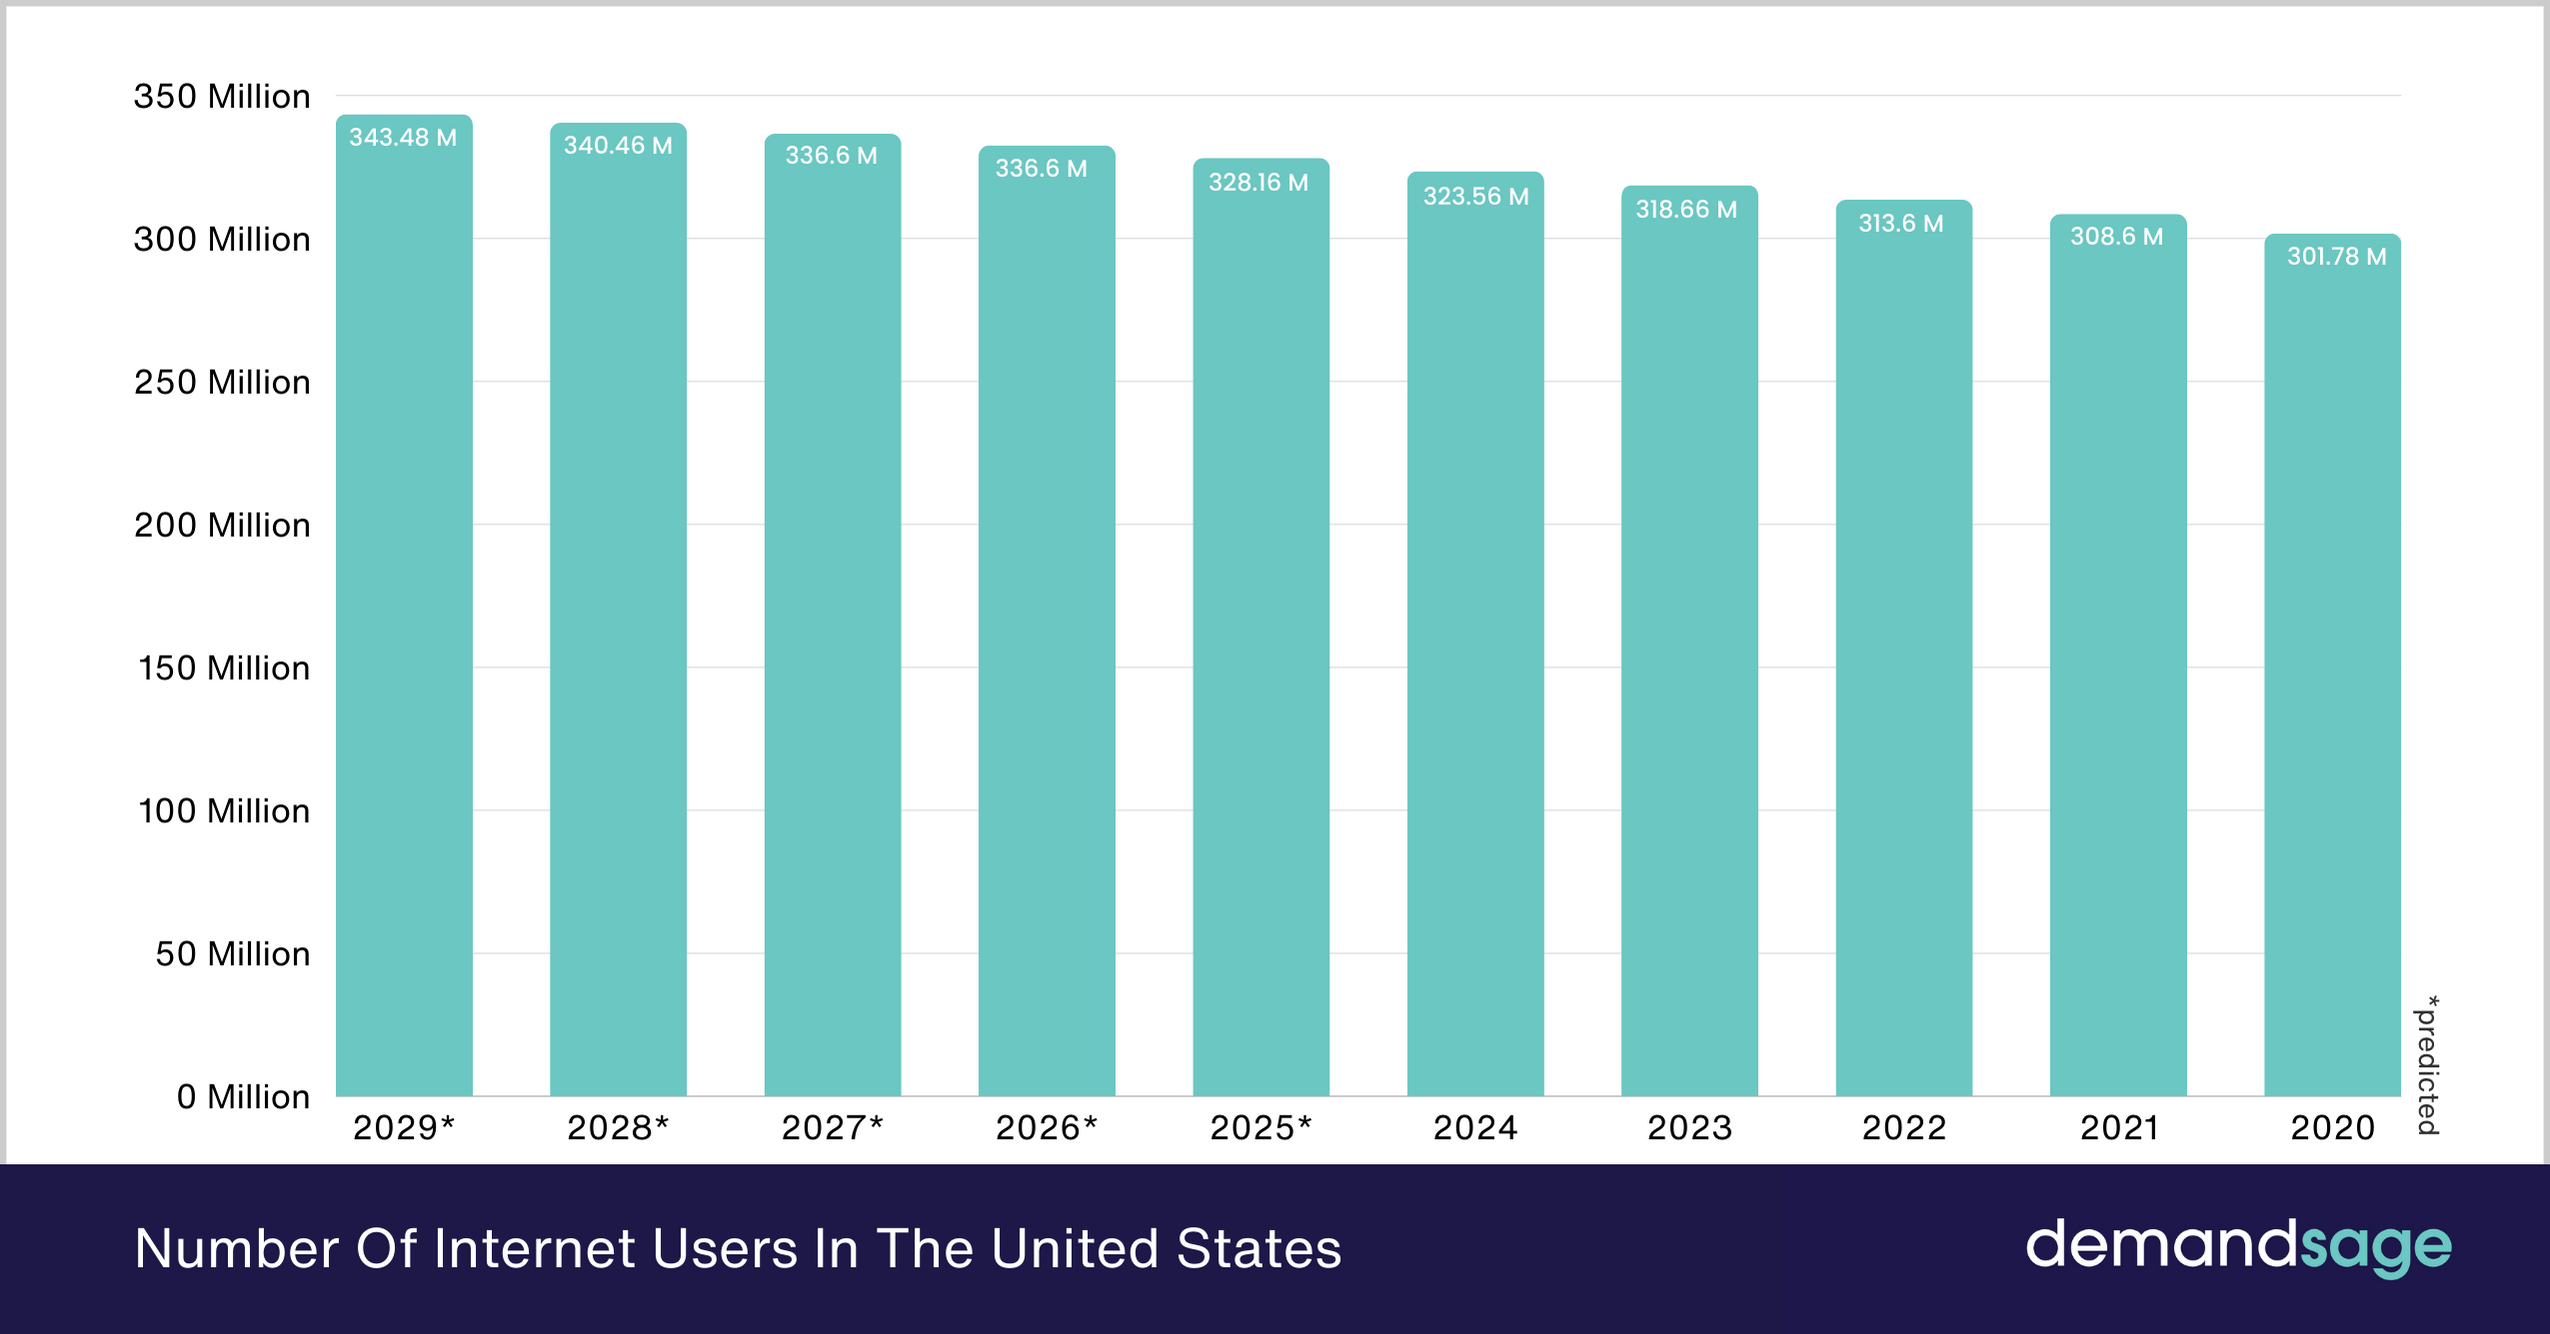
- 94% or 323.56 million American adults use the internet in 2024.

Here is a table showing the number of internet users in the United States:
| Year | Number of Internet Users In The US |
|---|---|
| 2029* | 343.48 million |
| 2028* | 340.46 million |
| 2027* | 336.6 million |
| 2026* | 332.51 million |
| 2025* | 328.16 million |
| 2024 | 323.56 million |
| 2023 | 318.66 million |
| 2022 | 313.6 million |
| 2021 | 308.6 million |
| 2020 | 301.78 million |
Source: Statista *Projected numbers
- In 2020, global internet traffic was reported to be 92 times greater than in 2005.
- Every minute, Americans generate 3,138,420 GB of internet traffic.
- In 2021, 54.4% of the global traffic was reported to be generated from mobile devices compared to the year 2009, when only 0.7% of the traffic was generated from mobile devices.
Source: Cisco, eMarketer, Statista, broadband search.
Internet User Penetration Rate And Usage Statistics
Globally, more than half of the people have a connection to internet services. Here are a few stats related to global internet users that you must know.
- 97.6% of the population in Northern Europe had access to the internet, and it ranked first among the regions for the highest internet penetration rate.
- Western Europe had an internet usage penetration rate of 94.5%.
- Asia has the largest internet base, with more than 2.7 billion internet users.
Here is a table showing the penetration rate of the Internet in different regions:
| Region | Internet Penetration Rate |
|---|---|
| Northern Europe | 97.6% |
| Northern America | 96.8% |
| Western Europe | 94.5% |
| Southern Europe | 90.2% |
| Eastern Europe | 88.4% |
| Southern America | 82.5% |
| Central America | 72% |
| Oceania | 77.5% |
| Eastern Asia | 76.8% |
| Central Asia | 76.2% |
| Western Asia | 76.1% |
| Southern Africa | 73.1% |
| South-Eastern Asia | 71.5% |
| Caribbean | 70.2% |
| Northern Africa | 67.8% |
| World | 66.2% |
| Southern Asia | 51.5% |
| Western Africa | 42.3% |
| Middle Africa | 32.1% |
| Eastern Africa | 26.7% |
- North Korea has no internet penetration and ranks last globally.
Source: Statista, Cisco
Internet User Demographics
Let us take a look at the statistics related to internet users’ demographics in this section.
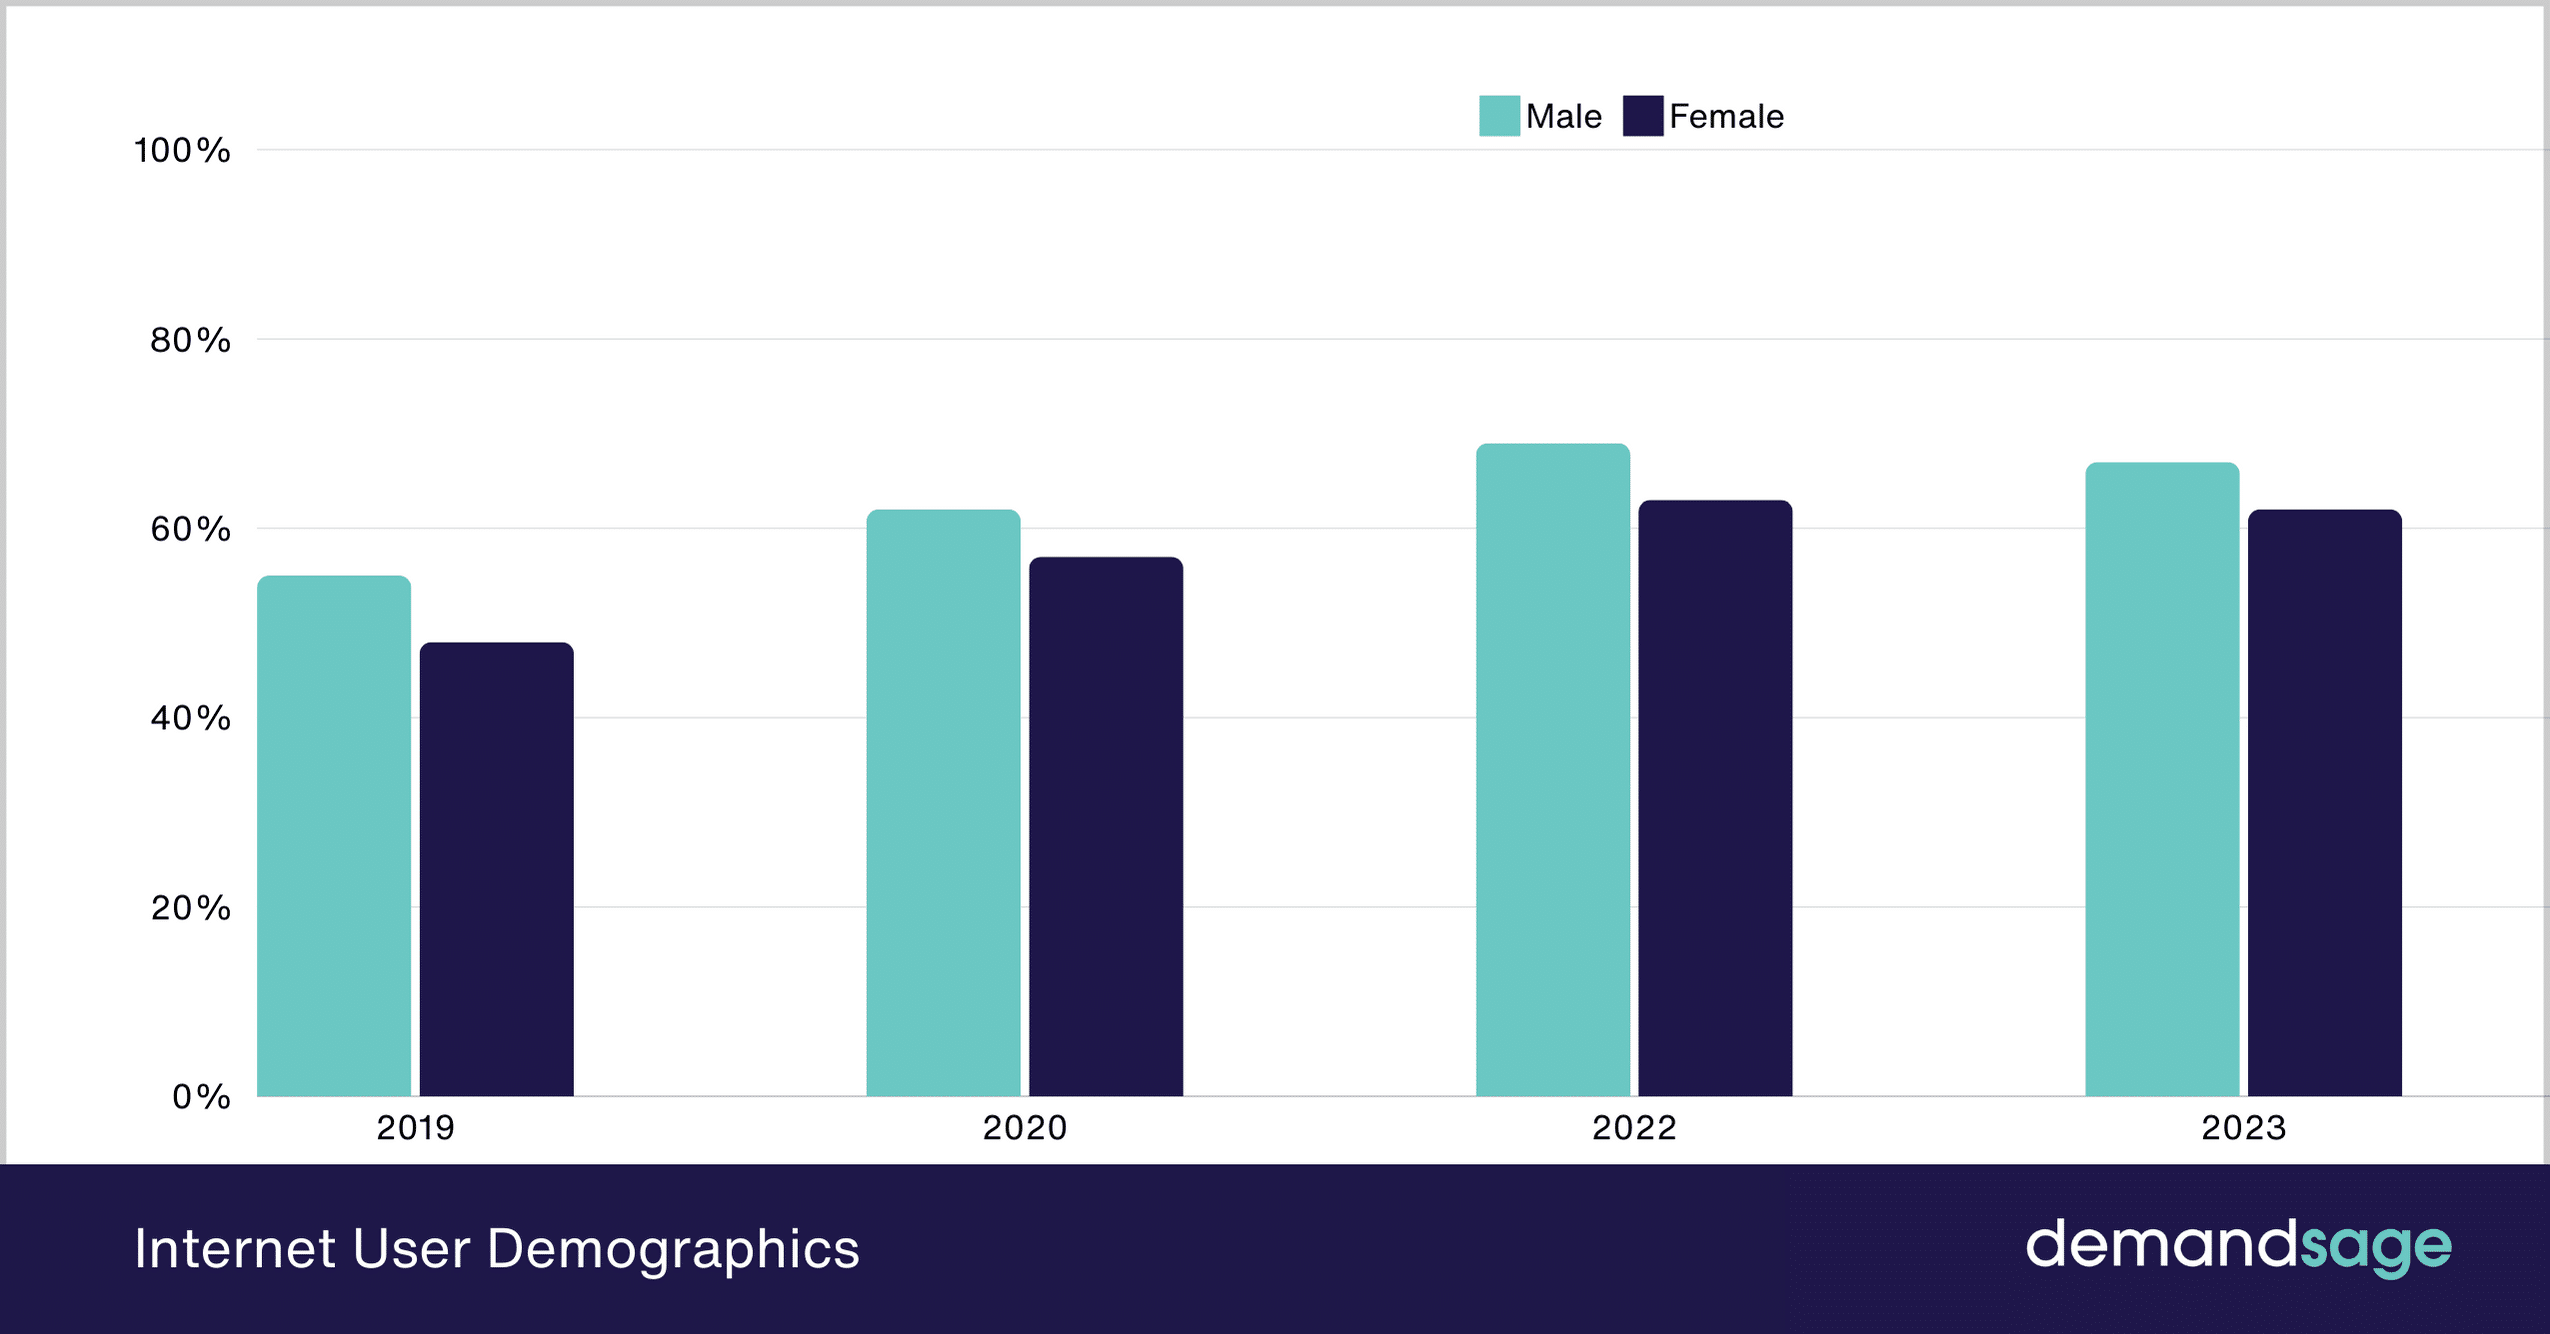
- 67% of the world’s males and 62% of females use the internet.

Here is a table showing the internet users based on gender:
| Year | Male | Female |
|---|---|---|
| 2019 | 55% | 48% |
| 2020 | 62% | 57% |
| 2022 | 69% | 63% |
| 2023 | 67% | 62% |
Source: Pewresearch.org, Statista.
Did You Know? More than 73% of Gen Alpha users use the internet. To learn more about this generation, refer to our article on Gen Alpha Statistics.
- 96% of women and 94% of men in the United States population use the internet.
Here is a table showing the distribution of internet users in the U.S. by gender:
| Year | Male | Female |
|---|---|---|
| 2023 | 94% | 96% |
| 2021 | 94% | 93% |
| 2019 | 90% | 91% |
| 2018 | 89% | 88% |
| 2016 | 89% | 86% |
| 2015 | 86% | 86% |
| 2014 | 84% | 84% |
| 2013 | 84% | 84% |
| 2012 | 83% | 82% |
Source: Pew Research
Mobile Internet User Statistics
- Over 311.36 million Americans access the internet via mobile devices.
The number of mobile internet users in the U.S. is forecasted to reach 333.18 million by 2029.
The table below shows the number of mobile internet users in the U.S. over the years:
| Year | Number of Mobile Internet Users |
|---|---|
| 2029* | 333.18 million |
| 2028* | 330.25 million |
| 2027* | 326.5 million |
| 2026* | 322.53 million |
| 2025* | 318.32 million |
| 2024* | 311.36 million |
| 2023 | 295.46 million |
| 2022 | 279.04 million |
| 2021 | 262.31 million |
| 2020 | 250.45 million |
Source: Statista *Projected numbers
- As of 2024, mobile internet usage has a penetration rate of around 86.26% in the United States.
The penetration rate of mobile internet users in the U.S. is expected to rise to 89.2% by 2029.
Here is a table showing the penetration rate of mobile internet users in the U.S. over the years:
| Year | Penetration Rate |
|---|---|
| 2029* | 89.2% |
| 2028* | 88.75% |
| 2027* | 88.24% |
| 2026* | 87.66% |
| 2025* | 87.01% |
| 2024* | 86.26% |
| 2023 | 85.39% |
| 2022 | 84.37% |
| 2021 | 83.15% |
| 2020 | 81.74% |
Source: Statista
Smartphone Users
Most internet users prefer mobile to carry out searches and get updated. Smartphones are convenient to carry everywhere and provide an easy search method. Here are a few stats related to smartphone internet users around the globe.
- Over 60% of total internet traffic came from mobile devices worldwide.
- Smartphone app usage time in the United States has increased by 25% since 2019.
- Mobile devices drive 65% of e-commerce traffic.
- The average person spent 3.46 hours per day using the internet via their mobile device.
Here is a list of the most popular mobile activities:
- Social media (92%)
- Browsing the web (89%)
- Checking email (87%)
- Using messaging apps (86%)
- Streaming videos (85%)
- Playing games (84%)
Source: Statista, Pewresearch.org, Cisco.
Social Media Statistics
A large portion of the time spent online is on social media sites. Let us uncover some interesting stats associated with internet usage and social media in this section
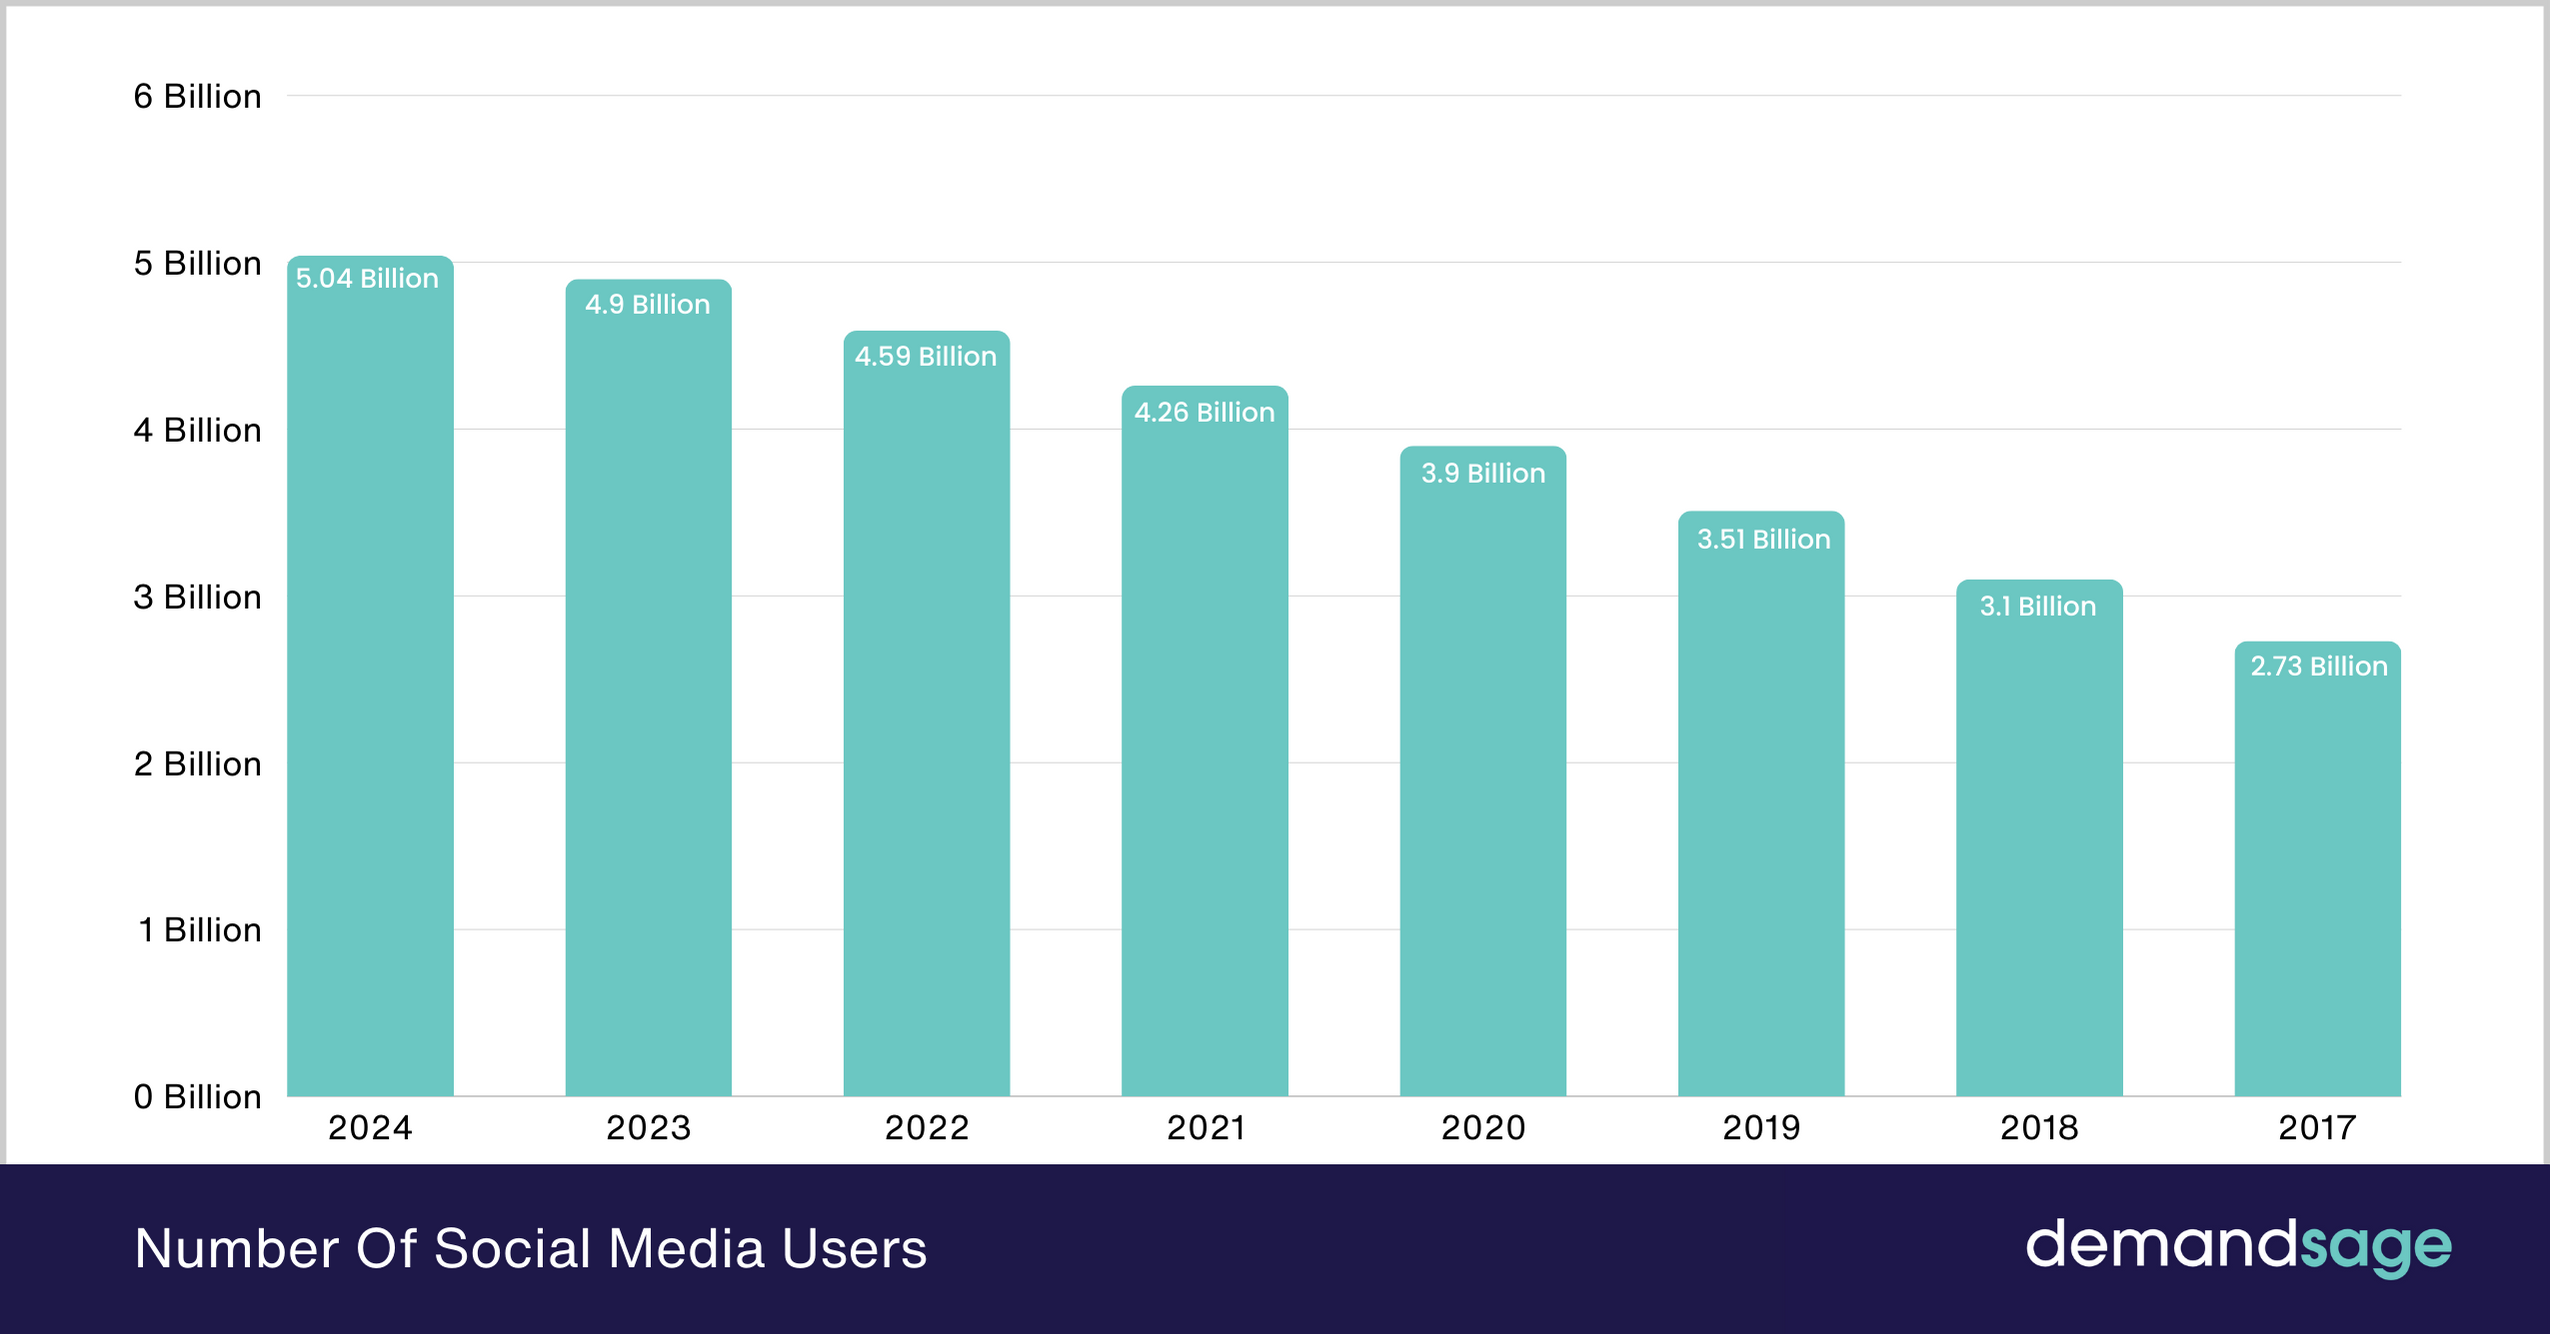
- As of January 2024, there are 5.04 billion social media users globally. (Statista)

| Year | Number of Social Media Users |
|---|---|
| 2024 | 5.04 billion |
| 2023 | 4.90 billion |
| 2022 | 4.59 billion |
| 2021 | 4.26 billion |
| 2020 | 3.9 billion |
| 2019 | 3.51 billion |
| 2018 | 3.1 billion |
| 2017 | 2.73 billion |
- Facebook was the first social media platform to surpass more than one billion account registrations. Today, it holds the position as the #1 social media platform in terms of users, too, with 3.05 billion users.
Here is a table representing the active users on different social media platforms:
| Social Media Platform | Number of Users |
|---|---|
| 3.05 billion | |
| Youtube | 2.49 billion |
| 2 billion | |
| 2 billion | |
| TikTok | 1.56 billion |
| 1.34 billion | |
| Facebook Messenger | 979 million |
| Telegram | 800 million |
| Snapchat | 750 million |
Source: Statista
- The United States has around 320.6 million social media users in 2024.
The number of social media users in the U.S. is forecasted to reach 342.6 million by 2029.
Here is a table showing the number of social media users in the U.S.:
| Year | Number of Social Media Users |
|---|---|
| 2029* | 342.6 million |
| 2028* | 339.38 million |
| 2027* | 335.24 million |
| 2026* | 330.77 million |
| 2025* | 325.91 million |
| 2024 | 320.6 million |
| 2023 | 314.76 million |
| 2022 | 308.39 million |
| 2021 | 301.64 million |
| 2020 | 292.51 million |
Source: Statista
- TikTok has been the most downloaded social media app in recent times.
- Eastern Asia has the most social media users (26%) as of 2024.
- China, with 1,021.96 million users, is the country with the most social media users. India ranks second with 755.47 million, and the United States makes it to the third spot with 302.25 million users.
- A typical social media user interacts with 6.6 social media platforms.
Source: Cisco, Statista.
Video Statistics
Videos are the most consumed digital media across all social media. So much so that experts now predict that even platforms like LinkedIn will witness high video usage.
Let us take a look at some interesting facts associated with online videos in this section:
- Online video is expected to account for 80% of all web traffic, making it the most popular type of content over the internet.
- 3.1 billion people consume videos on the internet every day.
- YouTube users watch 1 billion hours of video daily
- The short-form video provides the greatest ROI of any social media marketing tactic, according to a new HubSpot analysis of 2023 marketing trends.
- It was reported that 50% of users between the ages of 18 and 34 would drop their current tasks and watch a video on a channel they just subscribed to.
- 50% of the people watch videos of the products and their demos before buying them.
- If a person watches more than 6 minutes of a video, then it is likely that they will watch the whole video.
- 90% of the video views on Twitter are recorded through mobile.
- There is a 95% increase in the expenditure of video-based advertising.
Source: eMarketer, Statista
Search Engine Statistics
This section sheds light on insights related to search engines.
- Google Search owns approximately 91.37% of the search engine market share.
- Google accounts for 95.37% of the global mobile search engine market worldwide.
- 8.5 billion searches take place on Google every single day. That converts to 99,000 searches per second.
- With a mere 3.37% share, Microsoft’s Bing has the second spot in the search engine market.
- 60% of the search market share in China is owned by Baidu.
- More than 1 billion voice searches take place every month.
- Google Lens is used for 8 billion visual searches per month.
Source: Stat Counter
Ecommerce Statistics
Ecommerce is thriving, especially after the Covid-19 pandemic. Let us take a look at some insightful figures on the ecommerce market in this section.
- The number of e-commerce users is expected to reach 3.2 billion users by 2029.
- Mobile devices account for 70% of all visits to eCommerce sites.
- $3.4 trillion out of the $4.9 trillion online retail sales come from smartphones.
- 187.5 million mobile e-commerce users come from the United States.
- The Philippines and India lead the way for retail e-commerce sales growth.
Here is a table showing the countries with the most ecommerce sales growth:
| Country | Growth in Retail E-commerce |
|---|---|
| Philipines | 25.9% |
| India | 25.5% |
| Indonesia | 23% |
| Brazil | 22.2% |
| Vietnam | 19% |
| Argentina | 18.6% |
| Malaysia | 18.3% |
| Thailand | 18% |
| Mexico | 18% |
| United States of America | 15.9% |
Source: Statista, Cisco, eMarketer.
Conclusion
Nearly 66% of the global population uses the internet, and Northern Europe has the largest penetration rate of around 97.6%.
60% of internet traffic comes from mobile devices, and the United States has 311.36 million mobile internet users.
These were some essential statistics and facts regarding internet users in the world.
