
Social media has become a near-universal phenomenon in 2026, with approximately 69.9% of the world’s population actively using at least one platform.
Platforms such as Facebook, YouTube, and WhatsApp dominate global engagement, each connecting billions of users daily.
This report highlights social media users worldwide, countries with the most users, trends, and more.
Top Social Media Usage Statistics 2026
- There are approximately 5.79 billion social media users, representing 69.9% of the world’s population.
- In the United States, 93% of people (around 310 million) are active on social media.
- Facebook is still the largest social media platform, with over 3.07 billion users.
- People spend an average of 2 hours and 21 minutes on social media daily.
- Users typically engage with about 6.8 different social media platforms each month.
How Many People Use Social Media In The World In 2026?
There are approximately 5.79 billion social media users, representing nearly 2 in 3 people who now use social media globally.
This is a jump of 2.29% or (roughly 130 million) compared to Q3 2025, when social media users were 5.66 billion.
Note that this refers to total user accounts/identities, not necessarily all unique active users
In addition, 93.8% of the internet users in the world now use social media, regardless of their age. Even more striking, more than 69.9% of the world’s population uses social media.
On average, people use about 6.8 different social media platforms each month around the world.

Here is a table displaying the number of social media users recorded over time:
| Quarter Year | Number Of Social Media Users | YoY Increase |
|---|---|---|
| Q1 2026 | 5.79 billion | – |
| Q3 2025 | 5.66 billion | – |
| Q2 2025 | 5.41 billion | 6.7% |
| Q1 2025 | 5.24 billion | 4% |
| Q4 2024 | 5.22 billion | 5.5% |
| Q3 2024 | 5.17 billion | 5.9% |
| Q2 2024 | 5.07 billion | 5.6% |
| Q1 2024 | 5.04 billion | 5.9% |
| Q4 2023 | 4.95 billion | – |
| Q3 2023 | 4.88 billion | – |
| Q2 2023 | 4.80 billion | – |
| Q1 2023 | 4.76 billion | – |
Source: Date Reportal, Data Reportal July 2025, Mid-Year Global Report 2026
YoY percentages are calculated by dividing the difference between the user number in a given quarter and the user number in the same quarter of the preceding year by the user number in the given quarter.
How Many People Use Social Media in America?
As per the last data recorded, 310 million people in the United States use social media.

That’s about 93% of the total population of the US. The number of users has remained fairly steady compared to last year.
On average, a person engages with 6.5% of all social media platforms available in the country, suggesting that users are dispersing their attention across apps rather than spending more time on one.
On the other hand, estimates from Statista predict the US to have 316.07 million social media users in 2026, and it’s projected to grow further, reaching 330.07 million social media users by 2029.
Source: Data Reportal, Statista
How Much Time Do People Spend On Social Media Per Day?
On average, people spend around 2 hours and 21 minutes daily on social media. In the U.S., this figure is slightly lower, with Americans averaging 2 hours and 9 minutes per day, 12 minutes less than the global average.
While social media helps people stay connected, excessive screen time can have downsides. According to the American Psychological Association, prolonged social media use may contribute to anxiety and depression, emphasizing the need for a balanced and mindful approach.
Source: Data Reporal, American Psychological Association.
Which Country Has The Most Social Media Users?
China has the highest number of social media users worldwide. 1.18 billion people in the country use social media, and this number is anticipated to reach 1.36 billion by 2030.

India, the United States, and Indonesia are the other countries with the highest number of social media users.
The following table provides insights into the number of social media users by country.
| Country | 2025 (In millions) | 2030* (In millions) |
|---|---|---|
| China | 1,185.78 | 1,361.94 |
| India | 874.45 | 1,127.08 |
| United States | 312.99 | 328.91 |
| Indonesia | 203.35 | 235.58 |
| Brazil | 160.06 | 181.39 |
| Russia | 132.21 | 138.30 |
| Pakistan | 130.30 | 262.83 |
| Philippines | 114.62 | 123.88 |
| Mexico | 114.28 | 127.56 |
| Japan | 103.65 | 107.84 |
| Vietnam | 91.05 | 99.75 |
| Nigeria | 85.95 | 103.47 |
| Egypt | 83.81 | 98.74 |
*estimated numbers
Source: Statista.
Social Media User Demographics
Globally, social media has a slightly higher percentage of male users, with 54.6% of total users being men, while 45.4% are women.

However, in the United States, the gender split is more balanced. Women make up 50.2% of social media users, while men account for 49.8%. This near-equal distribution highlights how social media engagement varies across different regions and is influenced by cultural, social, and technological factors.
Source: Data reportal
Most Used Social Media Platforms (By Users)
Currently, Facebook remains the most used social media with an impressive 3.07 billion active users globally.
The second most popular social media platform is Instagram, with 3 billion users, followed by WhatsApp with the same number of users.
👉 For a more in-depth analysis, see our detailed breakdown of the latest WhatsApp statistics.
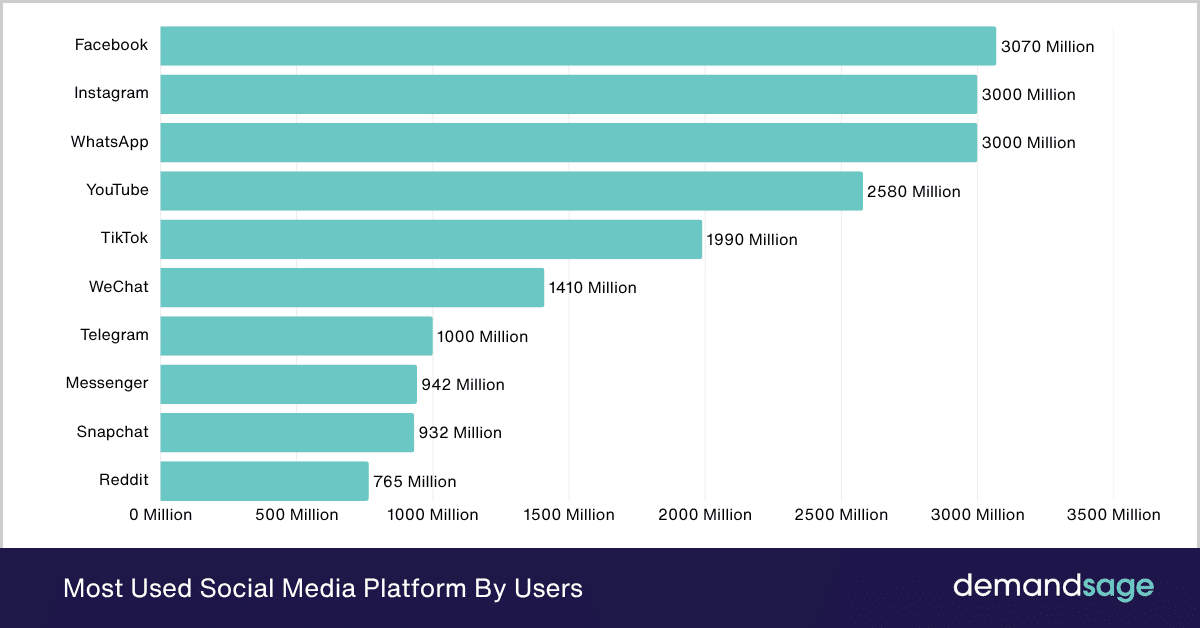
This table shows the biggest social media platforms globally:
| Rank | Platform | Users (in millions) |
|---|---|---|
| 1 | 3,070 | |
| 2 | 3,000 | |
| 2 | 3,000 | |
| 4 | YouTube | 2,580 |
| 5 | TikTok | 1,990 |
| 6 | 1,410 | |
| 7 | Telegram | 1,000 |
| 8 | Messenger | 942 |
| 9 | Snapchat | 932 |
| 10 | 765 |
Source: Data Reportal, Statista
Want to explore how video streaming dominates the digital landscape? Our full report on YouTube stats covers audience trends, creators, and watch time.
And if you’re Interested In Platform-Specific Stats, explore our detailed reports on these social media platforms:
Social Media Penetration By Country
The global social media penetration rate stands at 69.9%. Meaning nearly two-thirds of the world’s population is active on at least one platform.
Some countries far exceed this average, with Saudi Arabia reporting a 111.2% penetration rate (showing that many people use multiple accounts).
Here is a table displaying the social media usage by country:
| Country / Region | Penetration Rate |
|---|---|
| Saudi Arabia | 111.2% |
| UAE | 109.7% |
| South Korea | 95.4% |
| Singapore | 90.6% |
| China | 90.3% |
| Malaysia | 85% |
| Hong Kong | 84.4% |
| Netherlands | 83.3% |
| Canada | 82.1% |
| Philippines | 81.9% |
| Chile | 81.7% |
| Peru | 81.6% |
| Spain | 81.4% |
Source: Statista
Main Reasons For Using Social Media
The main reason people use social media is to stay connected with friends and family, with 50.8% of respondents citing this as their motivation.
Many users, 39.0%, also turn to social media to pass the time, highlighting its role as a popular entertainment option. Additionally, 34.5% of users rely on social media for news, showing how important these platforms have become for staying informed in our digital world.
Lastly, 19.5% of users engage with social media to avoid missing out on events and trends, reflecting the common fear of missing out (FOMO) that drives much of our online activity.
Here are further reasons users state for using social media:
| Reason for Using Social Media | Percentage |
|---|---|
| Keeping in touch with friends and family | 50.8% |
| Filling spare time | 39.0% |
| Reading news stories | 34.5% |
| Finding content (e.g., articles, videos) | 30.5% |
| Seeing what’s being talked about | 29.2% |
| Finding products to purchase | 27.3% |
| Finding inspiration for things to do and buy | 27.2% |
| Watching or following sports | 23.6% |
| Watching live streams | 23.4% |
| Seeing content from your favourite brands | 22.5% |
| Making new contacts | 22.1% |
| Work-related networking or research | 22.1% |
| Sharing and discussing opinions with others | 21.9% |
| Following celebrities or influencers | 19.7% |
| Avoiding missing out on things (FOMO) | 19.5% |
Source: Data Reportal
Social Media Advertisement Statistics
- Social media ad spending is projected to reach $317.33 billion in 2026.
- In terms of worldwide social media advertisement spending, the United States will generate $88.1 billion in 2028.
- It is estimated that mobile will produce $384.90 billion in total ad spending by 2027 in the Social Media Advertising market.
- The number of users in the Social Media Advertising segment is estimated to reach 5,851.53 million by 2027.
- 77% of marketers use Facebook and Instagram advertising as a marketing strategy to grow their brand and increase their reach.
Bonus: Look at our social media statistics worldwide for further insights into social media advertising and marketing facts and figures.
Conclusion: 5.79 Billion People Worldwide Use Social Media
Social media’s impact is staggering, with over 5.79 billion global users now driving content creation, marketing, and online interactions.
The global advertising spend on social platforms has surpassed $317.33 billion in 2026.
Platforms such as YouTube, WhatsApp, and Facebook remain at the center of this digital ecosystem, shaping global connectivity.
With average worldwide penetration at 69.9%, the trajectory is clear: social media adoption is expanding across demographics and regions.