The first iPhone came in 2007, taking the world by storm. To date, Apple has sold over 2.32 billion iPhones.
Although it’s been 15 years since the first iPhone hit the market, it remains one of the most used mobile devices in the world, with 151 million iPhone units shipped in the first three quarters of 2023 alone.
iPhones currently have 28.8% of the world’s smartphone market share. We see it increasing with the increased demand for the iPhone 15 series.
With such a huge market share, marketers worldwide need to know the facts and figures around it. I have compiled all the important iPhone statistics for marketers and iPhone enthusiasts in this post. We also have a dedicated section for iPhone 15 at the end!
Key iPhone Statistics (2024)
- There are more than 1.46 billion active iPhone users worldwide. They account for 21.67% of the world’s total smartphone-using population.
- There will be 1.56 billion iPhone units globally by the end of 2024.
- 151.3 million iPhone units were shipped and sold in the first three quarters of 2023.
- Over 2.3 billion iPhone units have been sold to date.
- iPhones held a 21% share of total smartphones shipped in Q1 2023.
- 51% of iPhone users are females, while 49% of iPhone users are males.
- iPhone has a 28.8% market share in the global smartphone industry as of 2024.
- iPhones have a 61.3% market share in the US smartphone industry as of 2024.
- Apple registered $211.99 billion in revenue in the first two quarters of 2023.
- Apple collected $117.11 billion in revenue from iPhone sales in the first two quarters of 2023.
How Many iPhone Users Are There In The World?
- There are over 1.46 billion iPhone users in the world.
This is an extraordinary 230.31% increase since the last decade. There were just 442 million iPhone users back in 2013.
This number is further predicted to reach 1.56 billion by 2024
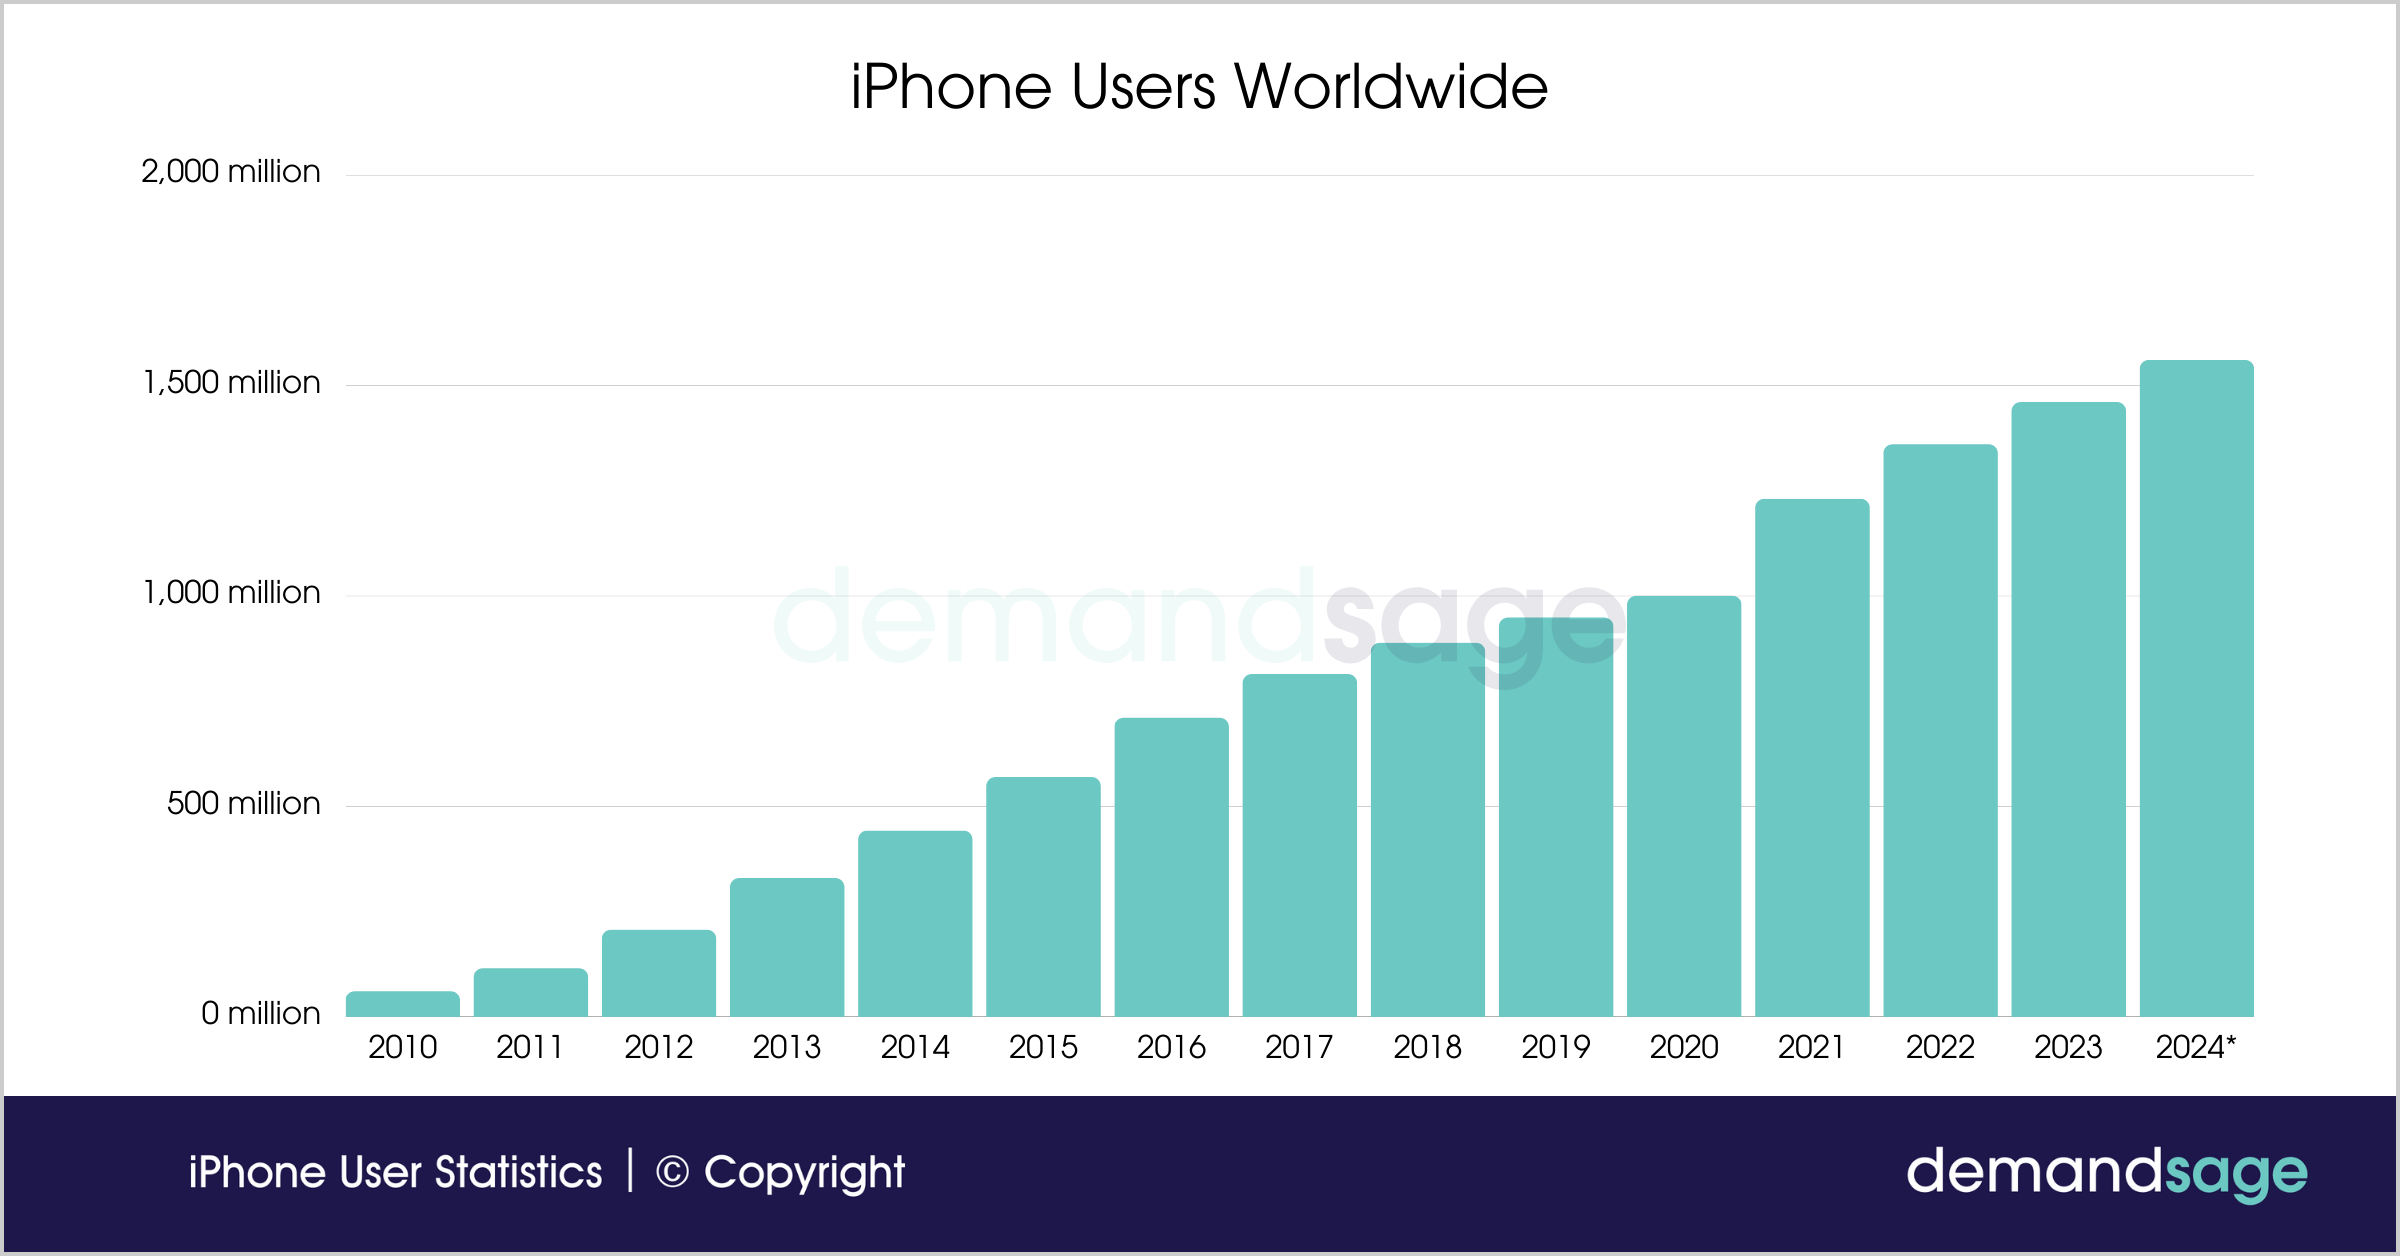
Here is the overview of iPhone users in the world over the years
| Year | No. of iPhone users |
|---|---|
| 2010 | 60 million |
| 2011 | 115 million |
| 2012 | 206 million |
| 2013 | 329 million |
| 2014 | 442 million |
| 2015 | 569 million |
| 2016 | 710 million |
| 2017 | 814 million |
| 2018 | 888 million |
| 2019 | 948 million |
| 2020 | 1 billion |
| 2021 | 1.23 billion |
| 2022 | 1.36 billion |
| 2023 | 1.46 billion |
| 2024* | 1.56 billion |
Number Of iPhone Users In The United States
- There are 135.97 million iPhone users in the United States, which is a 9.03% increase from 2022.
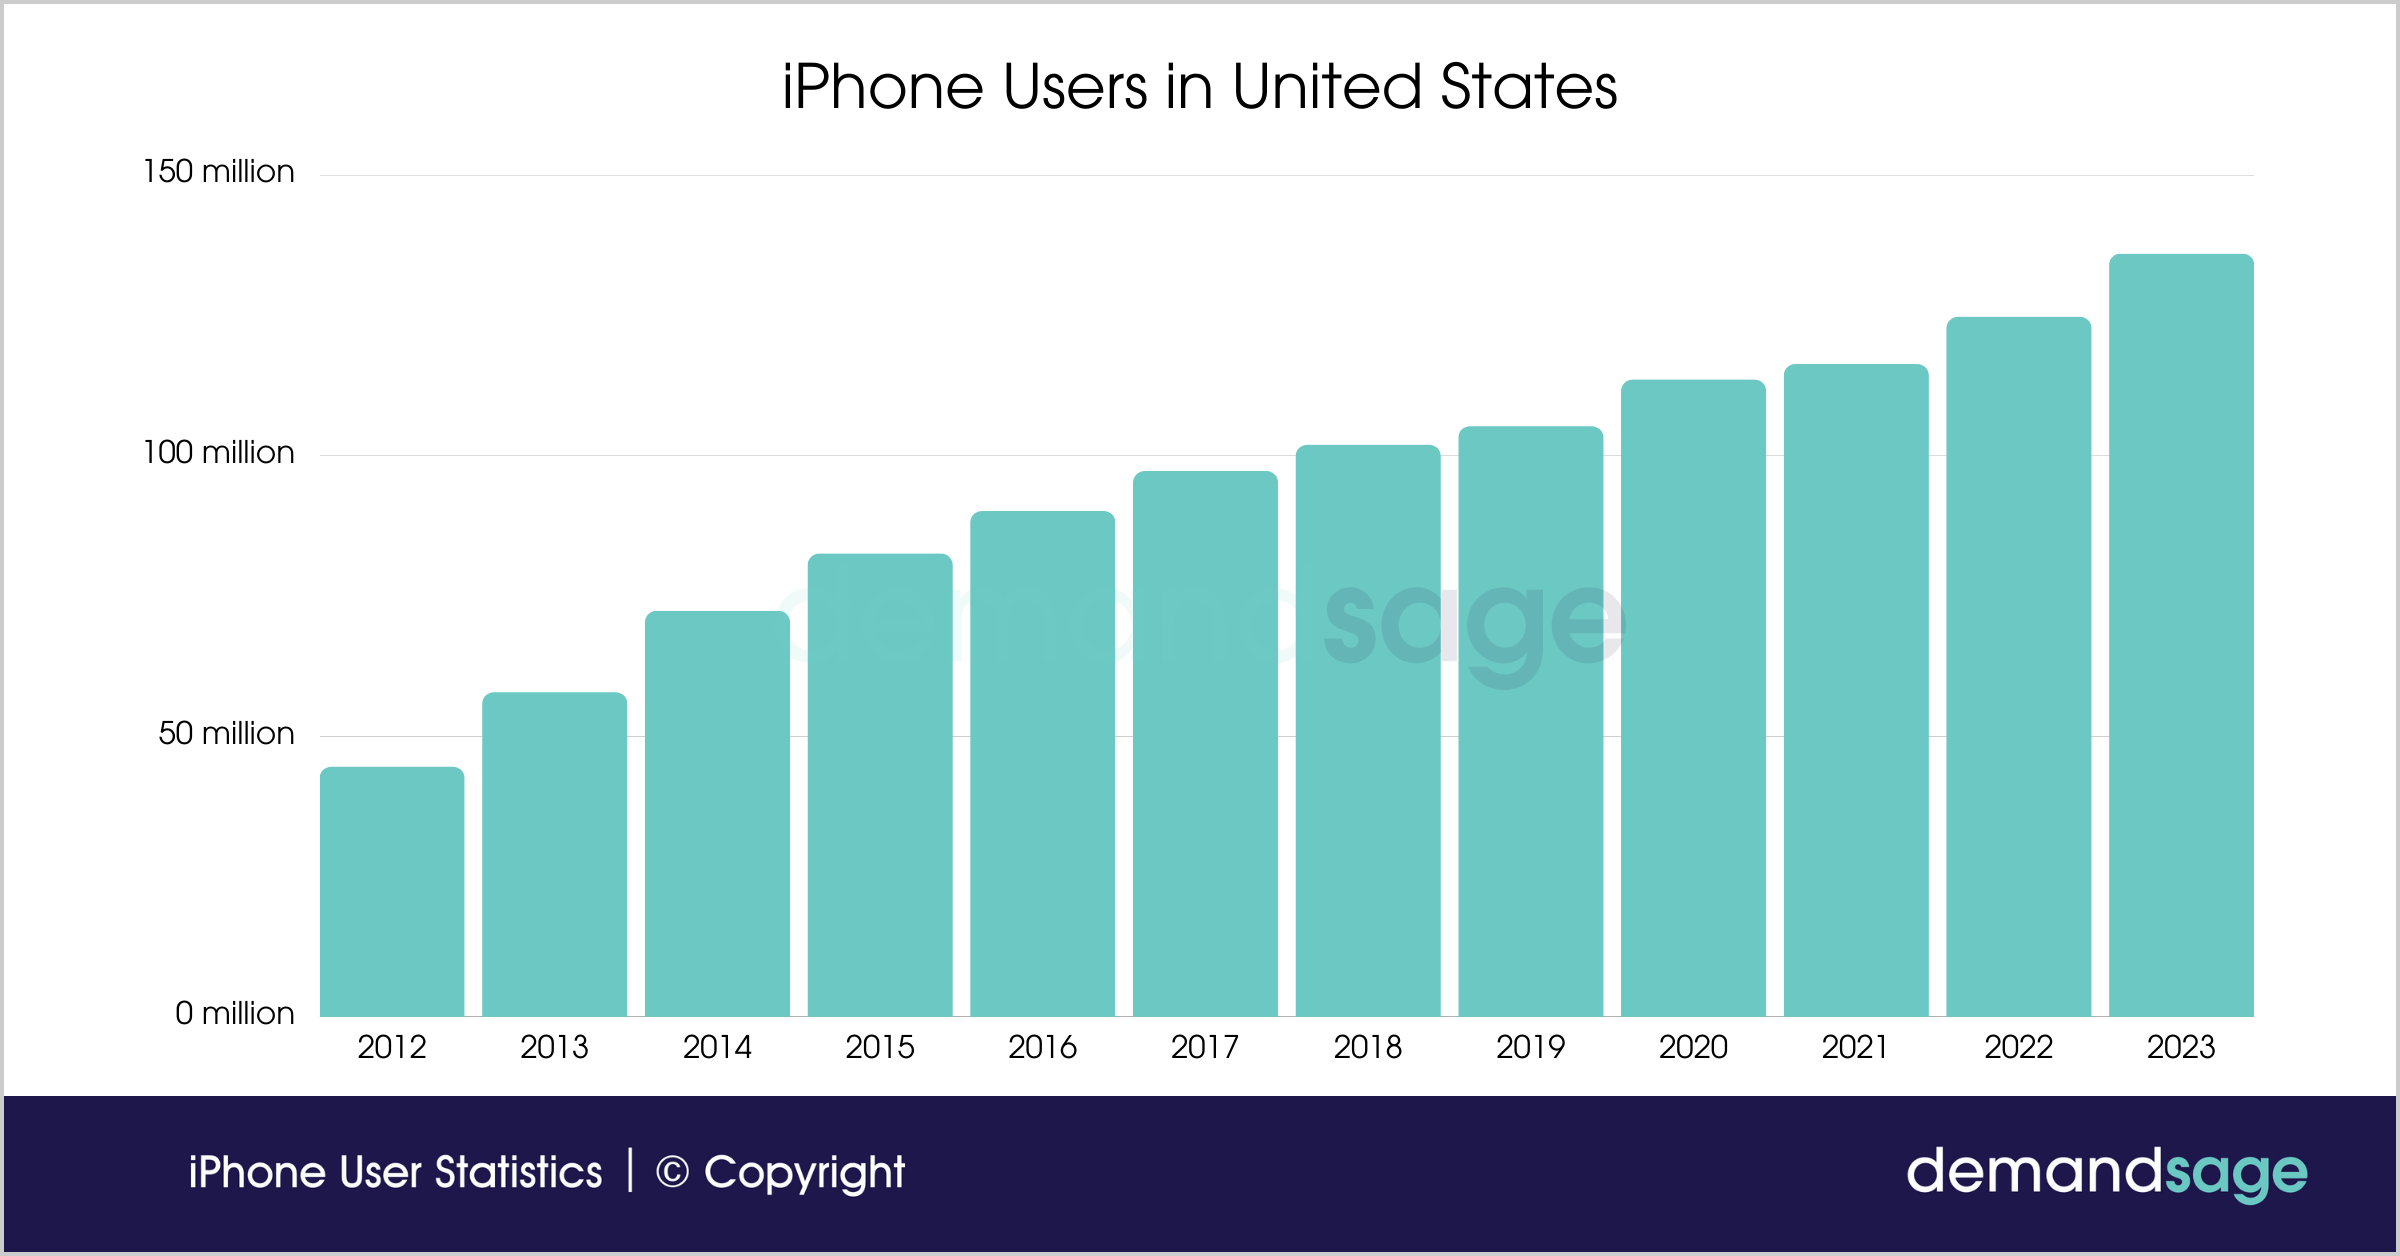
Here is the table showing the number of iPhone users in the United States over the years:
| Year | Number of iPhone Users in the US |
|---|---|
| 2012 | 44.53 million |
| 2013 | 57.8 million |
| 2014 | 72.3 million |
| 2015 | 82.5 million |
| 2016 | 90.1 million |
| 2017 | 97.2 million |
| 2018 | 101.9 million |
| 2019 | 105.2 million |
| 2020 | 113.5 million |
| 2021 | 116.3 million |
| 2022 | 124.7 million |
| 2023 | 135.97 million |
Share of iPhone Users Among Other Smartphone Users In The US
- 61% of smartphone users in the United States use an iPhone.
iPhones’ premium positioning with a sleek design and effortless user experience has captured the US market. The tightly integrated Apple ecosystem is highly addictive, especially with the ever-growing working class. Also, with its own operating system, app store, and suite of services, it creates a loyal customer base.
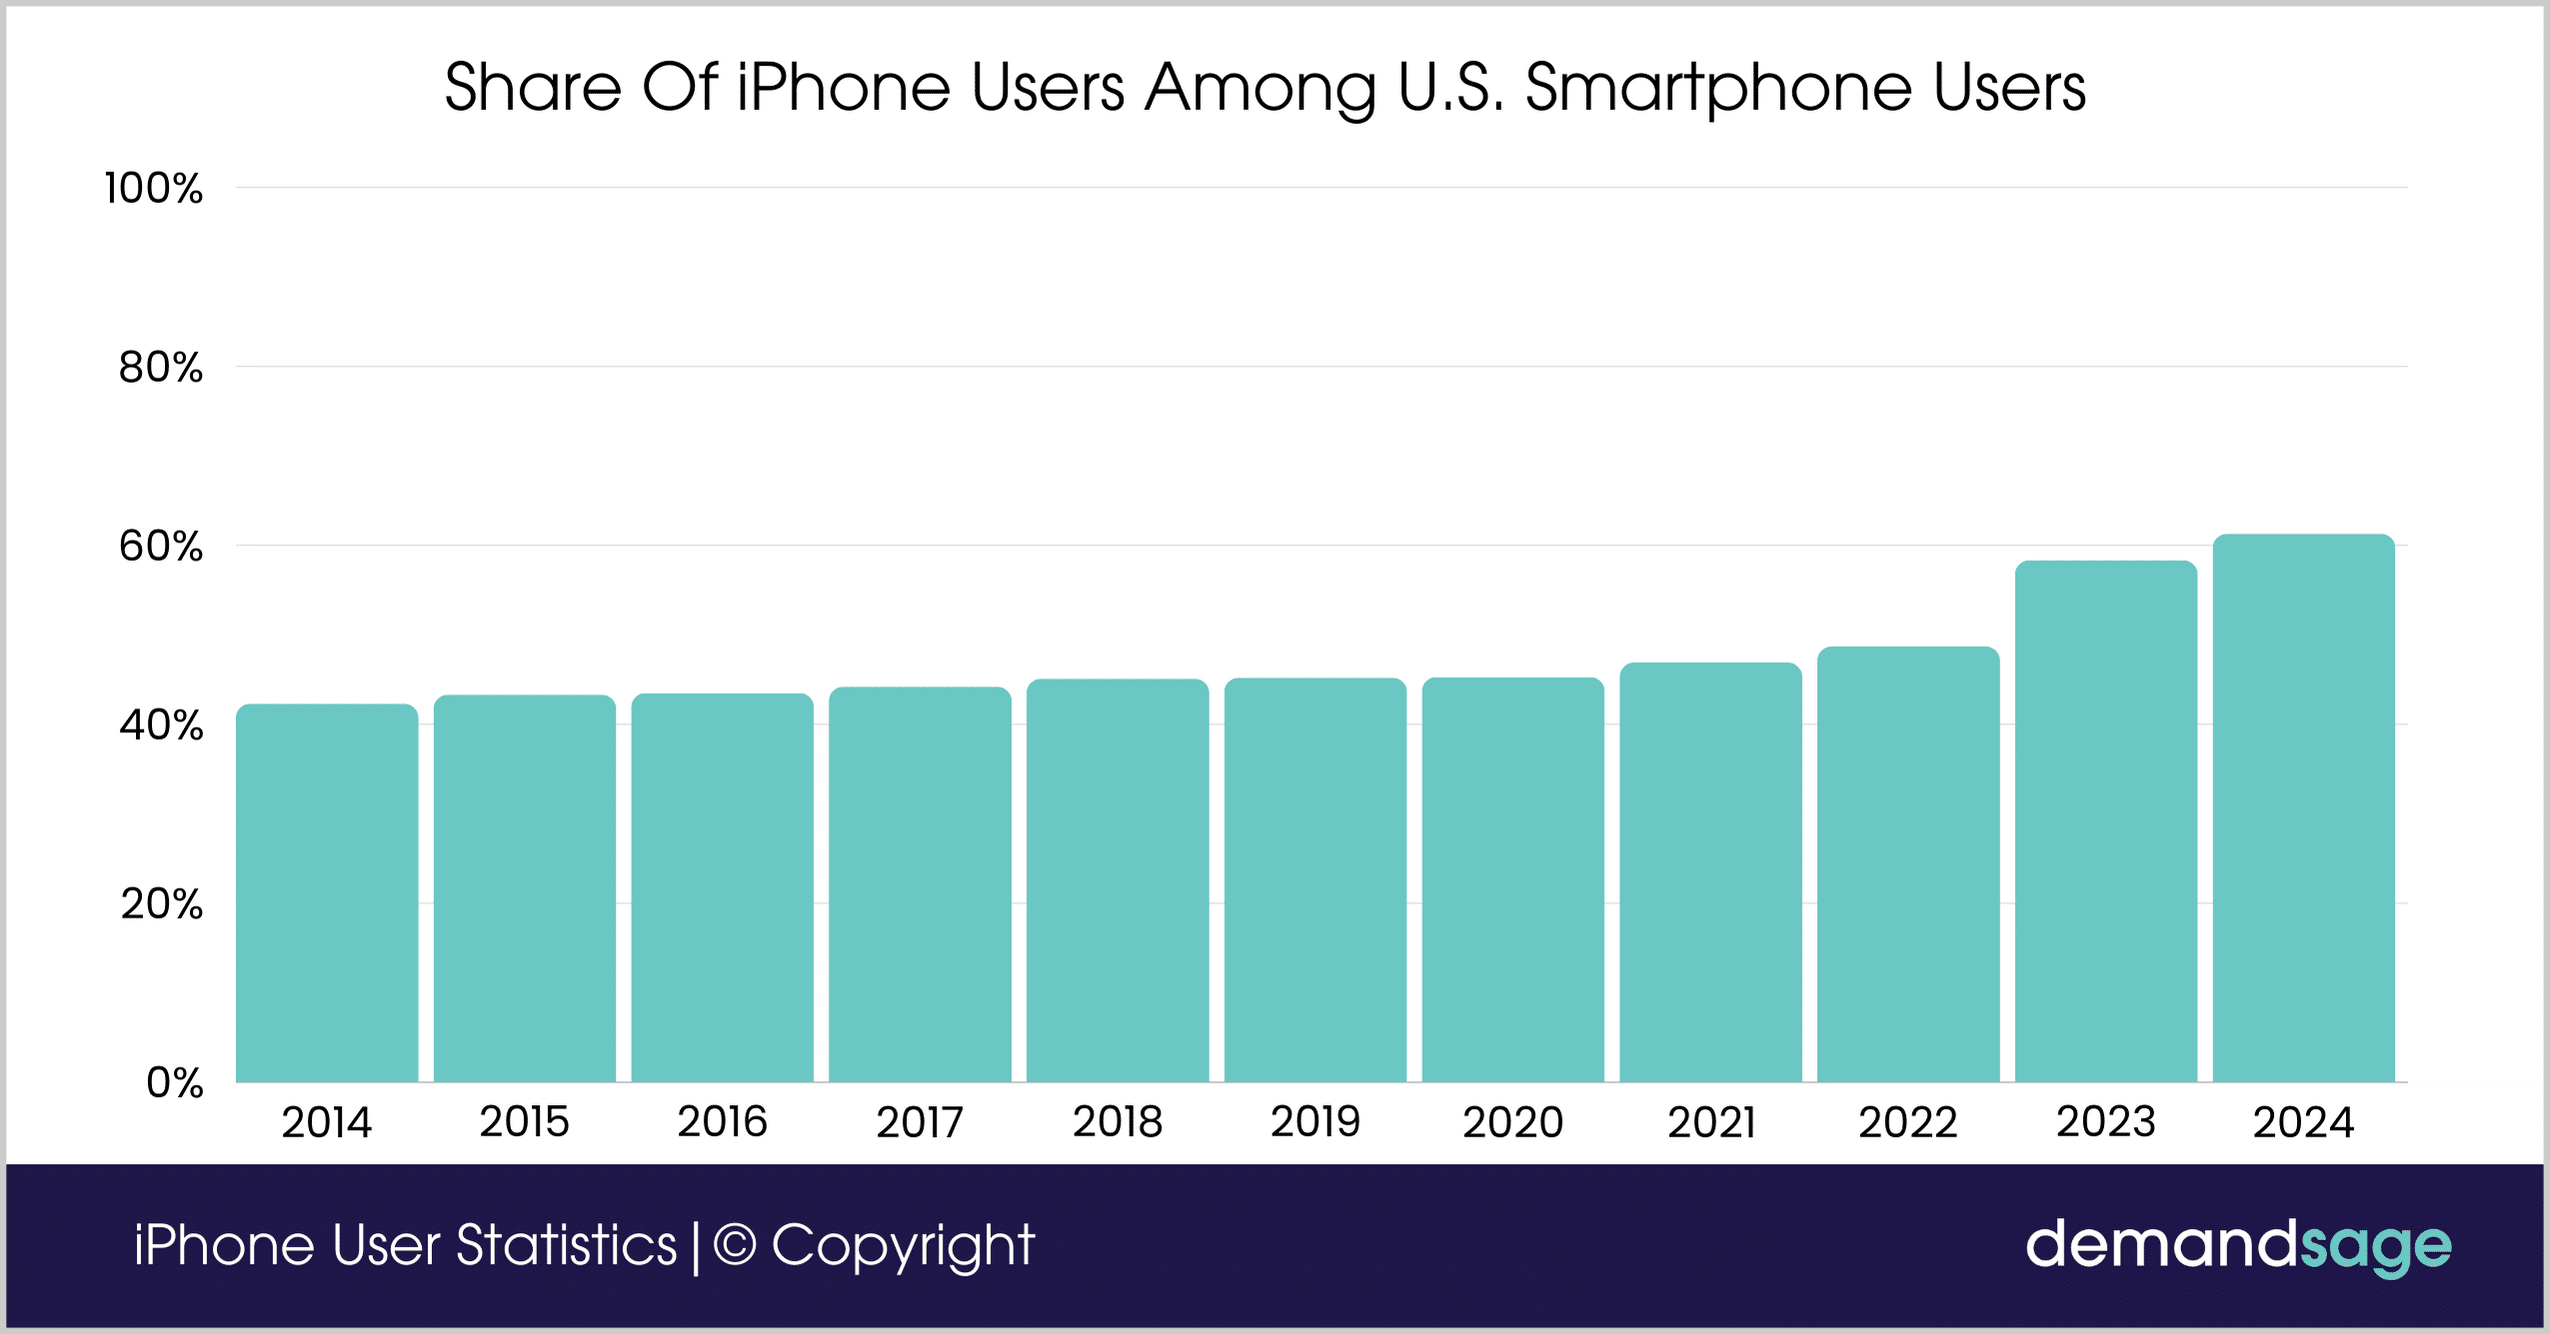
Here is a table showing the share of iPhone users among U.S. smartphone users throughout the years:
| Year | Share of iPhone Users |
|---|---|
| 2014 | 42.3% |
| 2015 | 43.3% |
| 2016 | 43.5% |
| 2017 | 44.2% |
| 2018 | 45.1% |
| 2019 | 45.2% |
| 2020 | 45.3% |
| 2021 | 46.9% |
| 2022 | 48.7% |
| 2023 | 58.33% |
| 2024 | 61.3% |
iPhone Sales And Shipment Statistics
- Apple has sold 151.3 million iPhone units globally in 2023.
55.2 million units were sold in the first quarter, 42.5 million in the second and 53.6 million units in the third quarter.
Apple sold most phones in the third quarter, which is mainly due to the launch of the iPhone 15, Apple’s latest flagship!
Apple made a total of 225.3 million global iPhone sales in 2022.
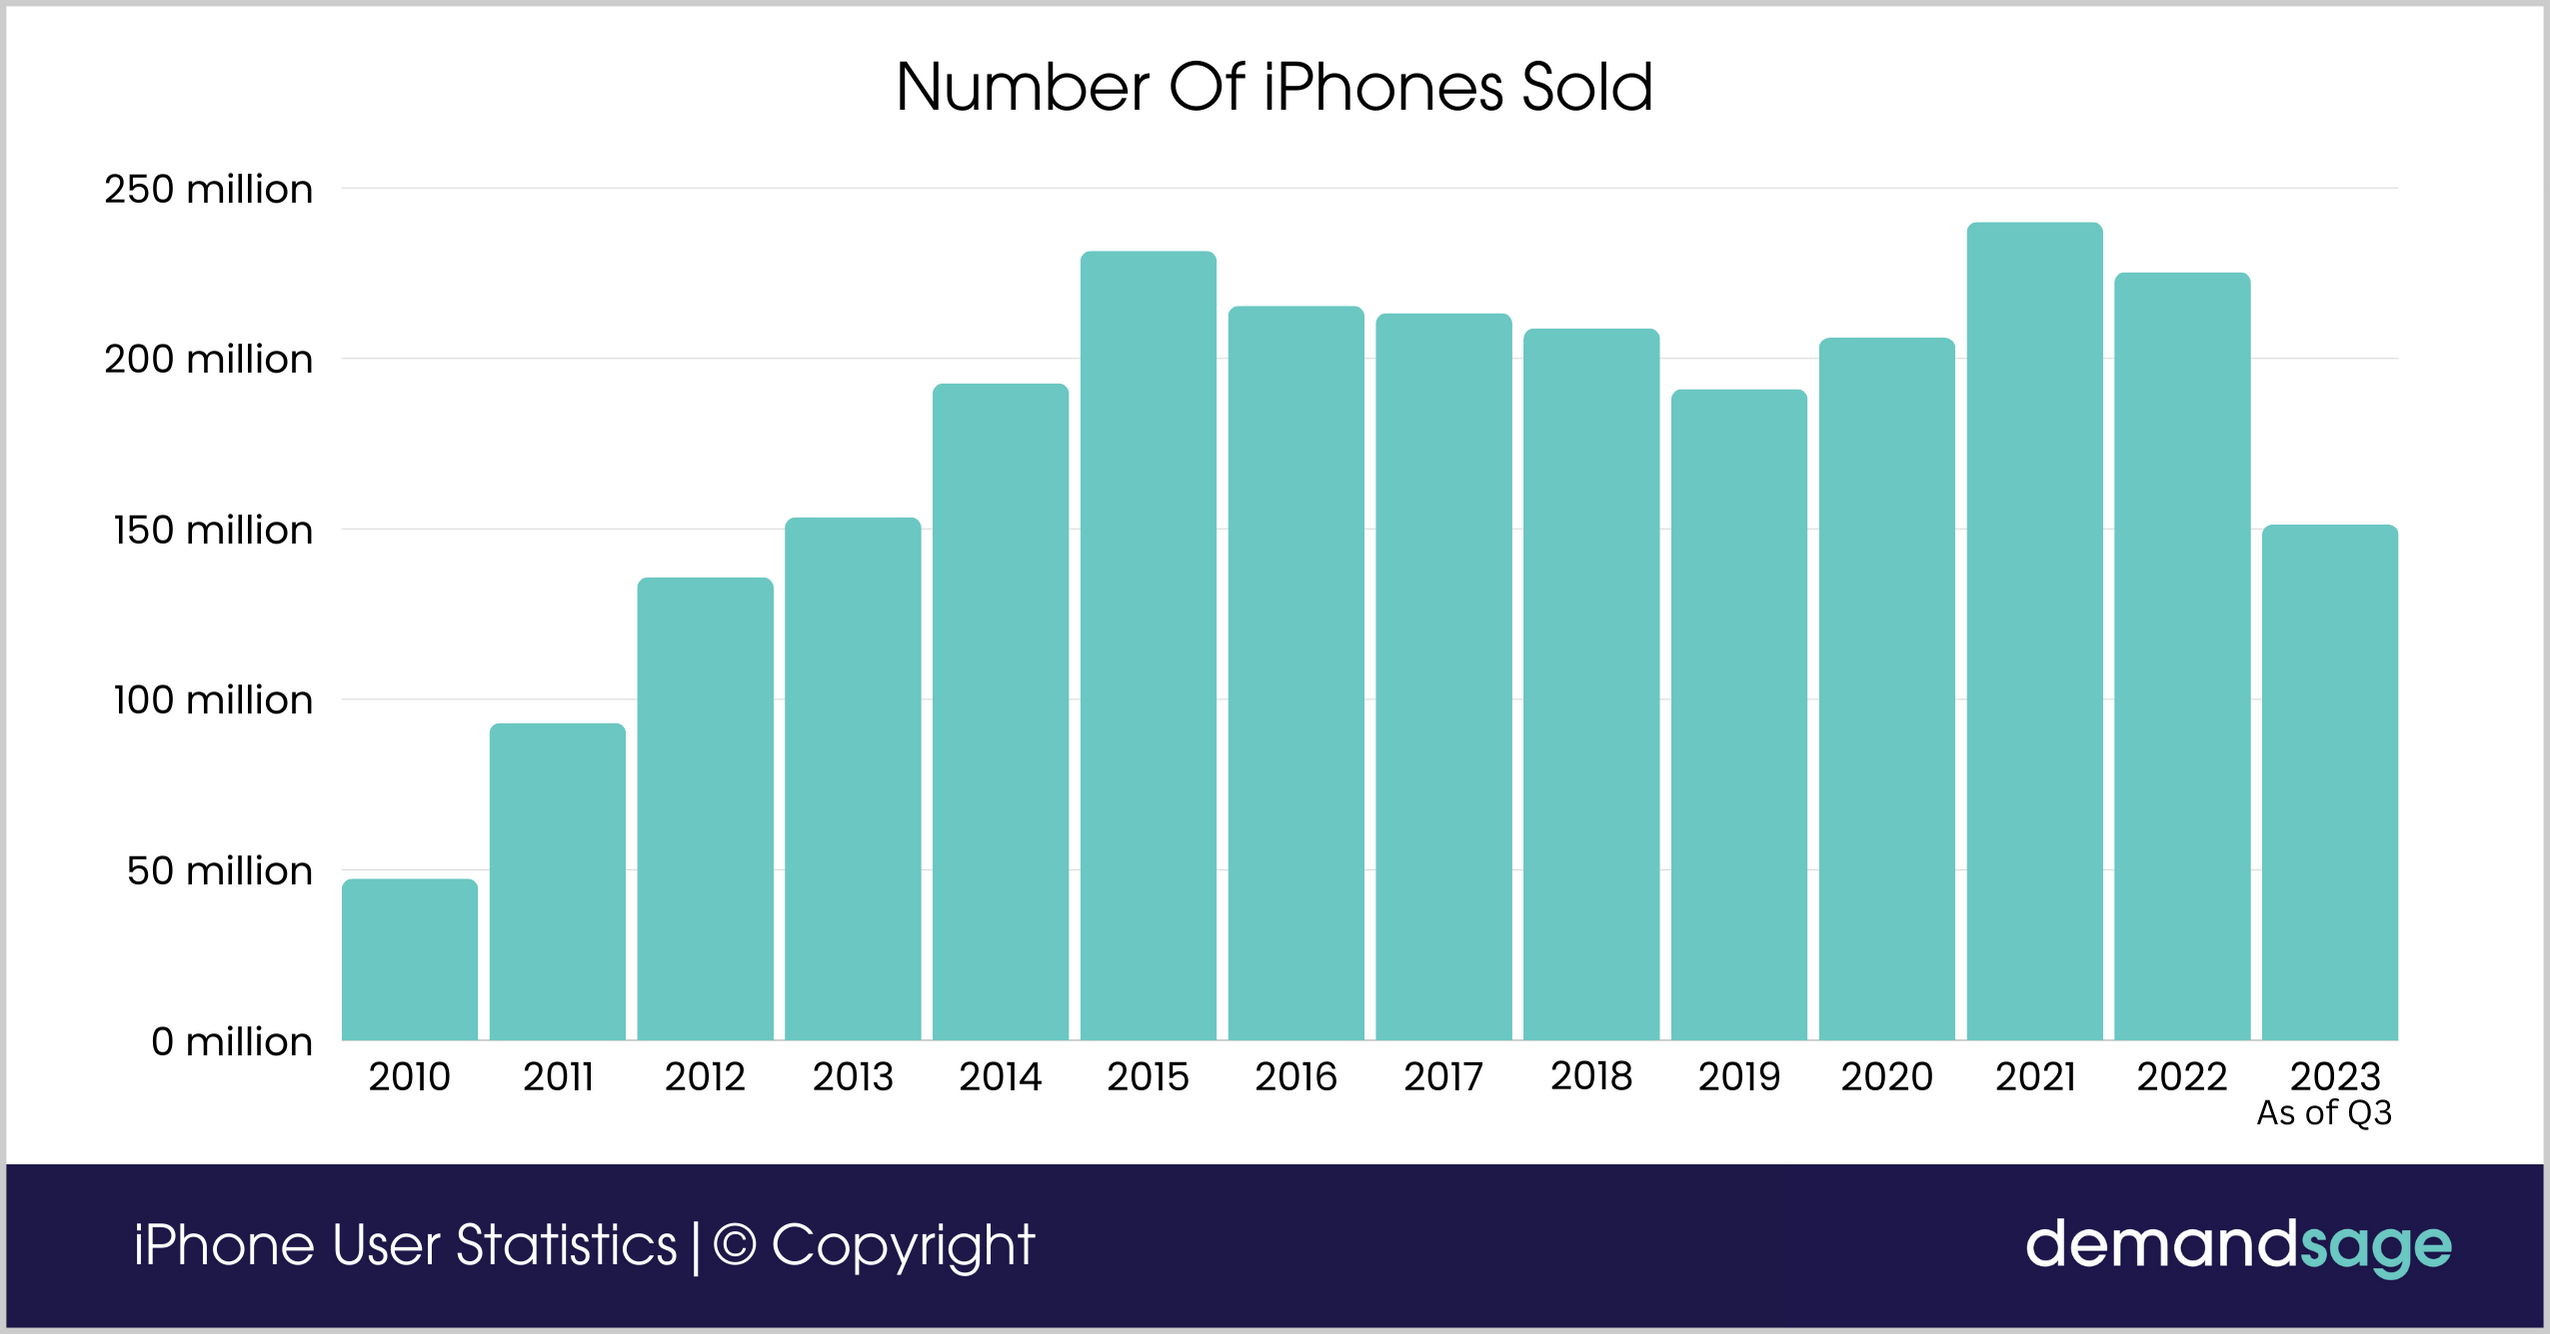
Here is a table showing the number of iPhones sold over the years:
| Year | No. of iPhones shipped |
|---|---|
| 2010 | 47.4 million |
| 2011 | 93.1 million |
| 2012 | 135.8 million |
| 2013 | 153.4 million |
| 2014 | 192.7 million |
| 2015 | 231.5 million |
| 2016 | 215.4 million |
| 2017 | 213.3 million |
| 2018 | 208.8 million |
| 2019 | 191 million |
| 2020 | 206.1 million |
| 2021 | 240 million |
| 2022 | 225.3 million |
| 2023 (as of Q3) | 151.3 million |
- Apple sold 20 million iPhones in North America in the First Quarter of 2022.
- In the first quarter of 2022, Apple supplied roughly 1 million ‘made in India’ iPhones nationwide. That is an increase of 50% y/y in the Indian market.
- India is expected to assemble up to 50% of iPhones by 2027.
iPhone Market Share Statistics
- iPhone has a 28.8% market share in the global smartphone industry as of 2024.
- iPhone has a 61.3% market share in the US smartphone industry as of 2024.
- iPhone has a 22.37% market share in China as of 2024.
- iPhone has a 4.02% market share in India as of 2024.
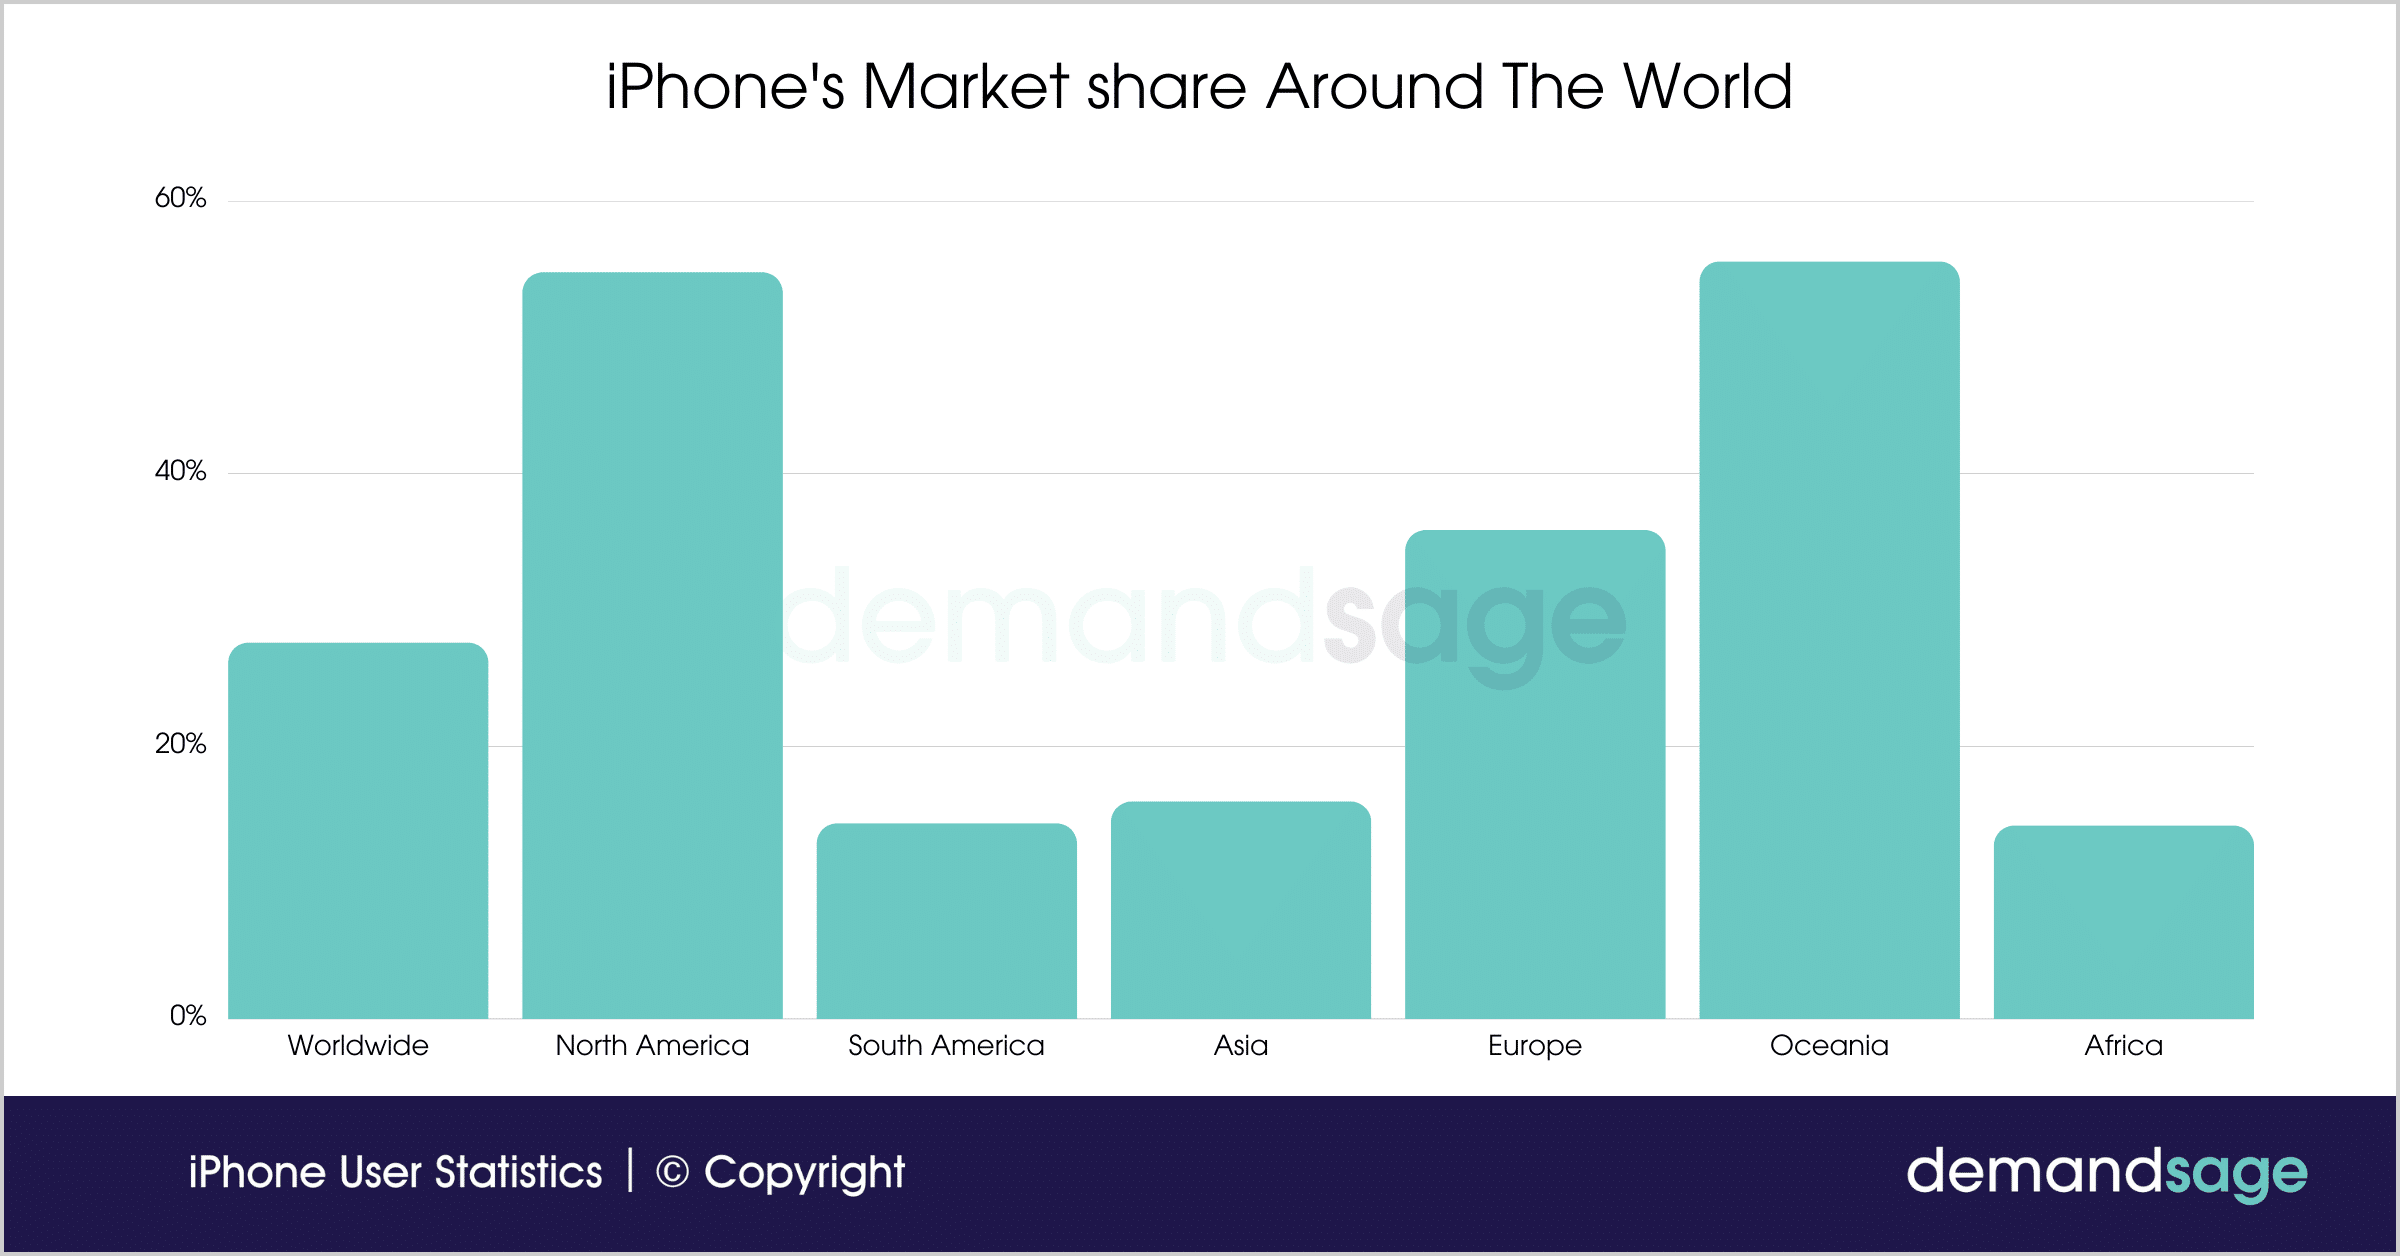
Below is the table showing the iPhone’s Market share in Different regions of the World:
| Region | iPhone Market Share |
|---|---|
| Worldwide | 27.6% |
| North America | 54.76% |
| South America | 14.33% |
| Asia | 15.94% |
| Europe | 35.84% |
| Oceania | 55.55% |
| Africa | 14.18% |
- If we look at the data from June 2021 to January 2024, the iPhone has an average market share of 55.94% in the United States.
- iPhone’s China market share stands at 20% as of August 2023.
Here is a table showing the iPhone’s Market Share in China from June 2021 to August 2023:
| Time of Year | iPhone’s Market Share |
|---|---|
| June 2021 | 21.95% |
| July 2021 | 20.84% |
| August 2021 | 20.68% |
| September 2021 | 20.47% |
| October 2021 | 18.99% |
| November 2021 | 19.28% |
| December 2021 | 21.08% |
| January 2022 | 20.84% |
| February 2022 | 20.44% |
| March 2022 | 20.27% |
| April 2022 | 21.37% |
| May 2022 | 23.36% |
| June 2022 | 23.96% |
| February 2023 | 23.97% |
| August 2023 | 20% |
Source: Statcounter
iPhone Users Demographic
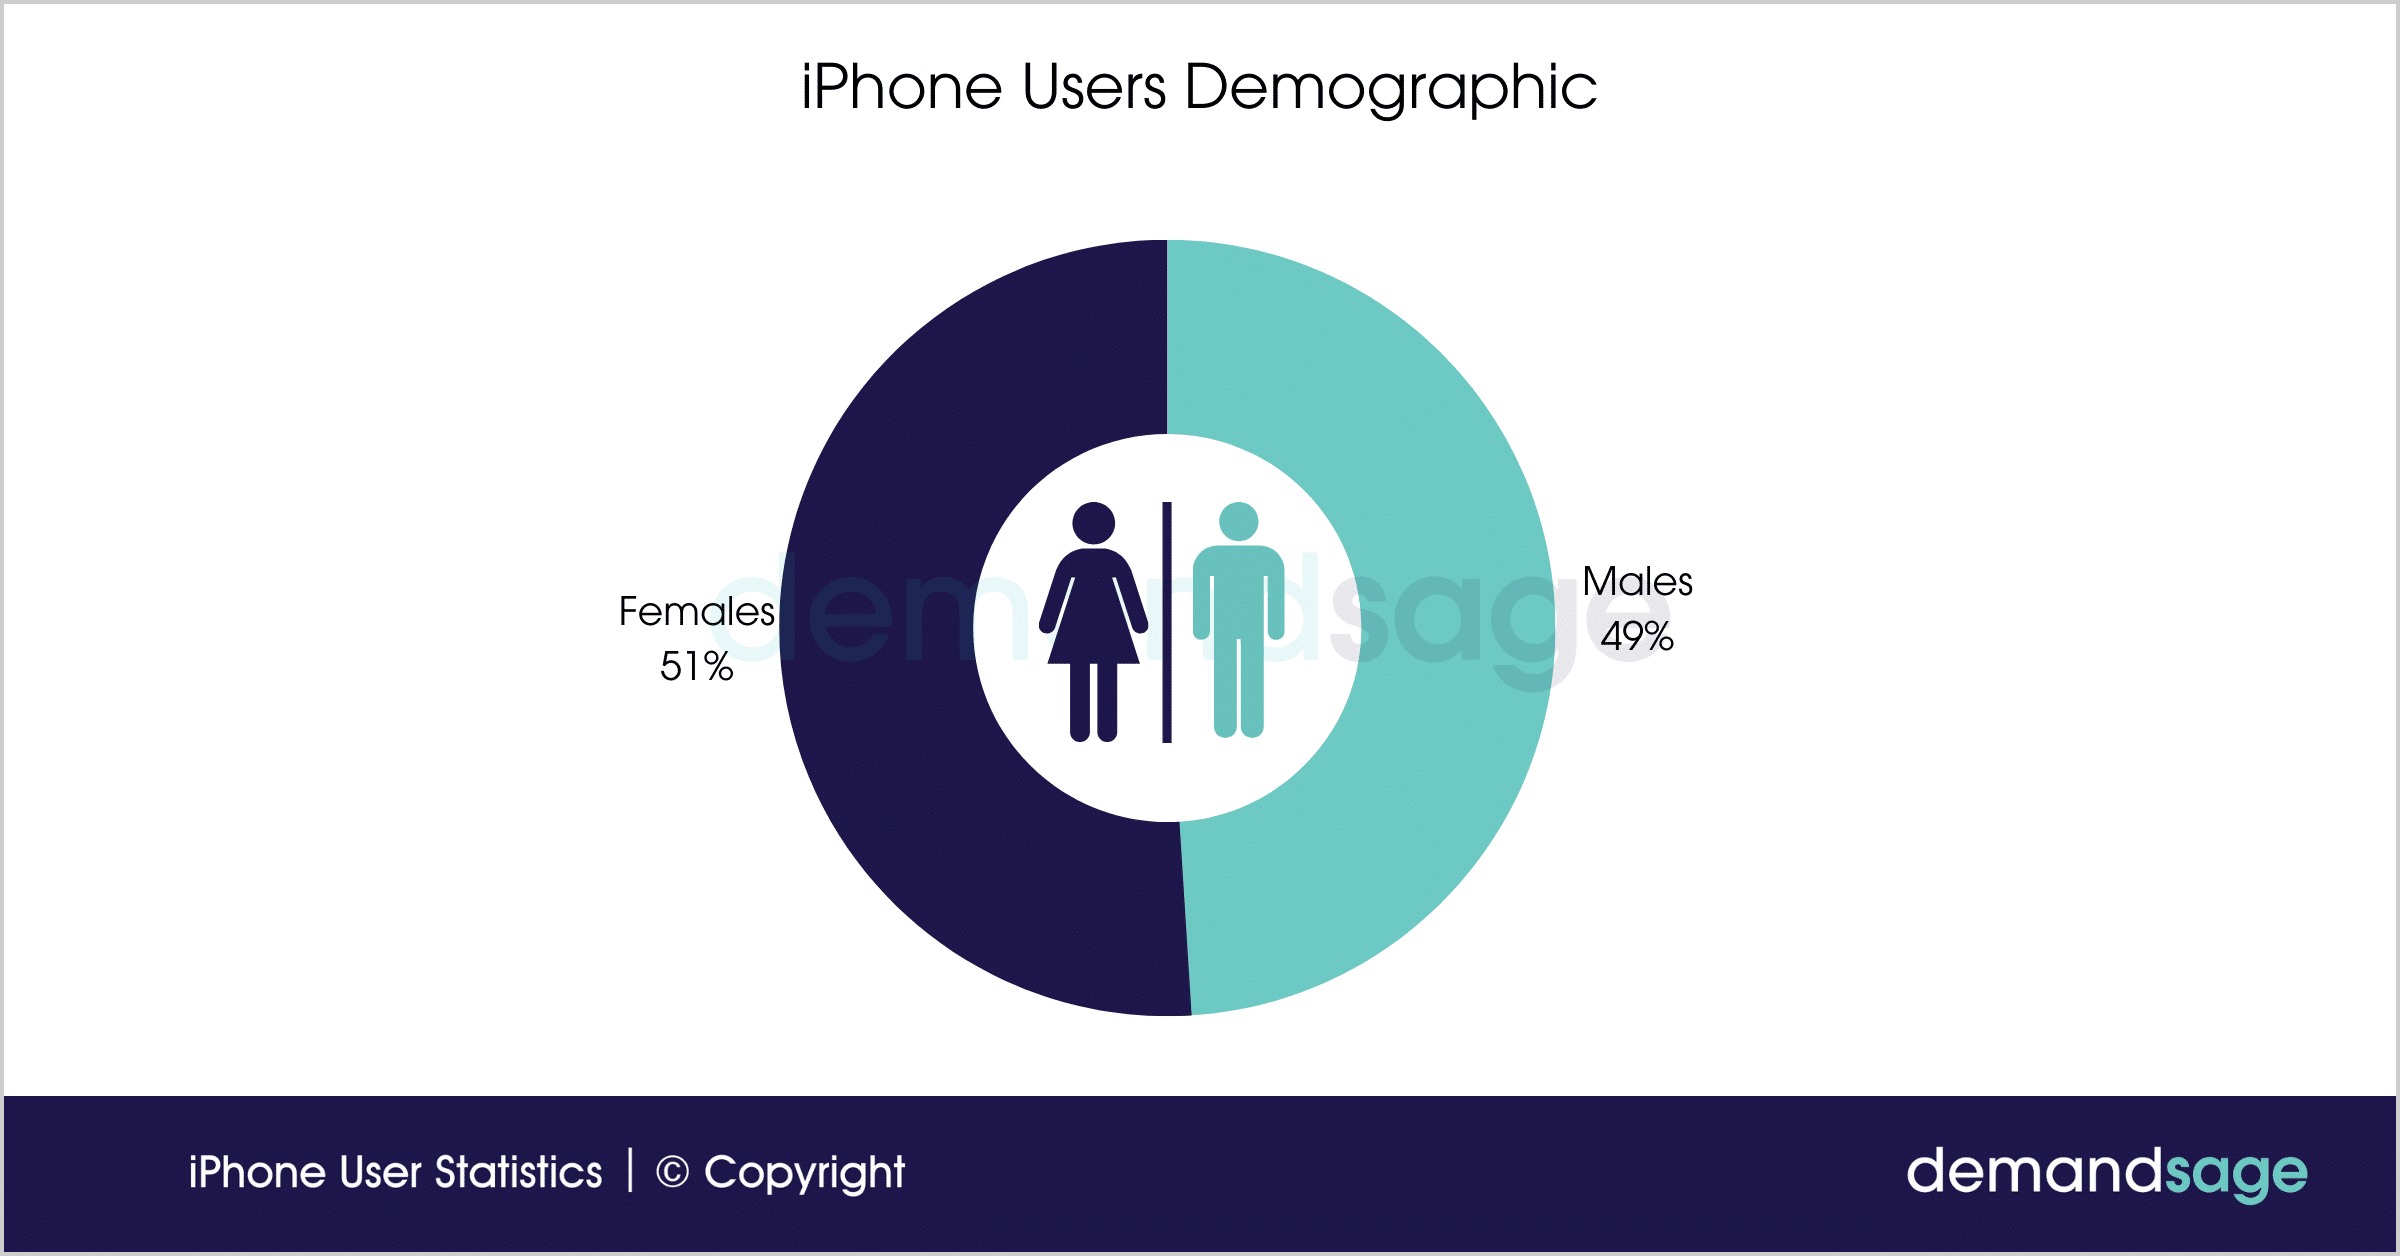
- 51% of iPhone users are females, while 49% of iPhone users are males.
- iPhones are most popular in the 16-34 year age group.
- 35% of people who use an iPhone have an Apple Watch too.
Most Popular Apps on iPhone
- Temu was the most downloaded app on iPhones in 2023.
Apple released its app store data in which it listed the top free and paid apps with highest downloads.
Temu, the online shopping app had the most number of downloads.
Here is a list of the Most Downloaded free iPhone Apps in 2023:
#1 Temu
#2 CapCut
#3 HBO Max
#4 Instagram Threads
#5 TikTok
#6 Instagram
#7Google
#8 YouTube
#9 WhatsApp Messenger
#10 Gmail
- Honor of Kings is the most popular iPhone app in terms of revenue.
Here is the list of the top 10 most popular iPhone Apps (in terms of revenue)
| iPhone App | Revenue |
|---|---|
| Honor of Kings | 1.652 billion |
| TikTok | 1.379 billion |
| Youtube | 1.058 billion |
| PUBG Mobile | 0.936 billion |
| Genshin Impact | 0.922 billion |
| Tinder | 0.641 billion |
| Candy Crush Saga | 0.4989 billion |
| Disney+ | 0.4983 billion |
| Roblox | 0.491 billion |
| Romance Three Kingdoms | 0.455 billion |
Apple’s iPhone Revenue Statistics
- Apple generated $156.78 billion in revenue from the sales of iPhones in the first three quarters of 2023.
iPhone sales currently account for 53.36% of Apple’s total revenue.
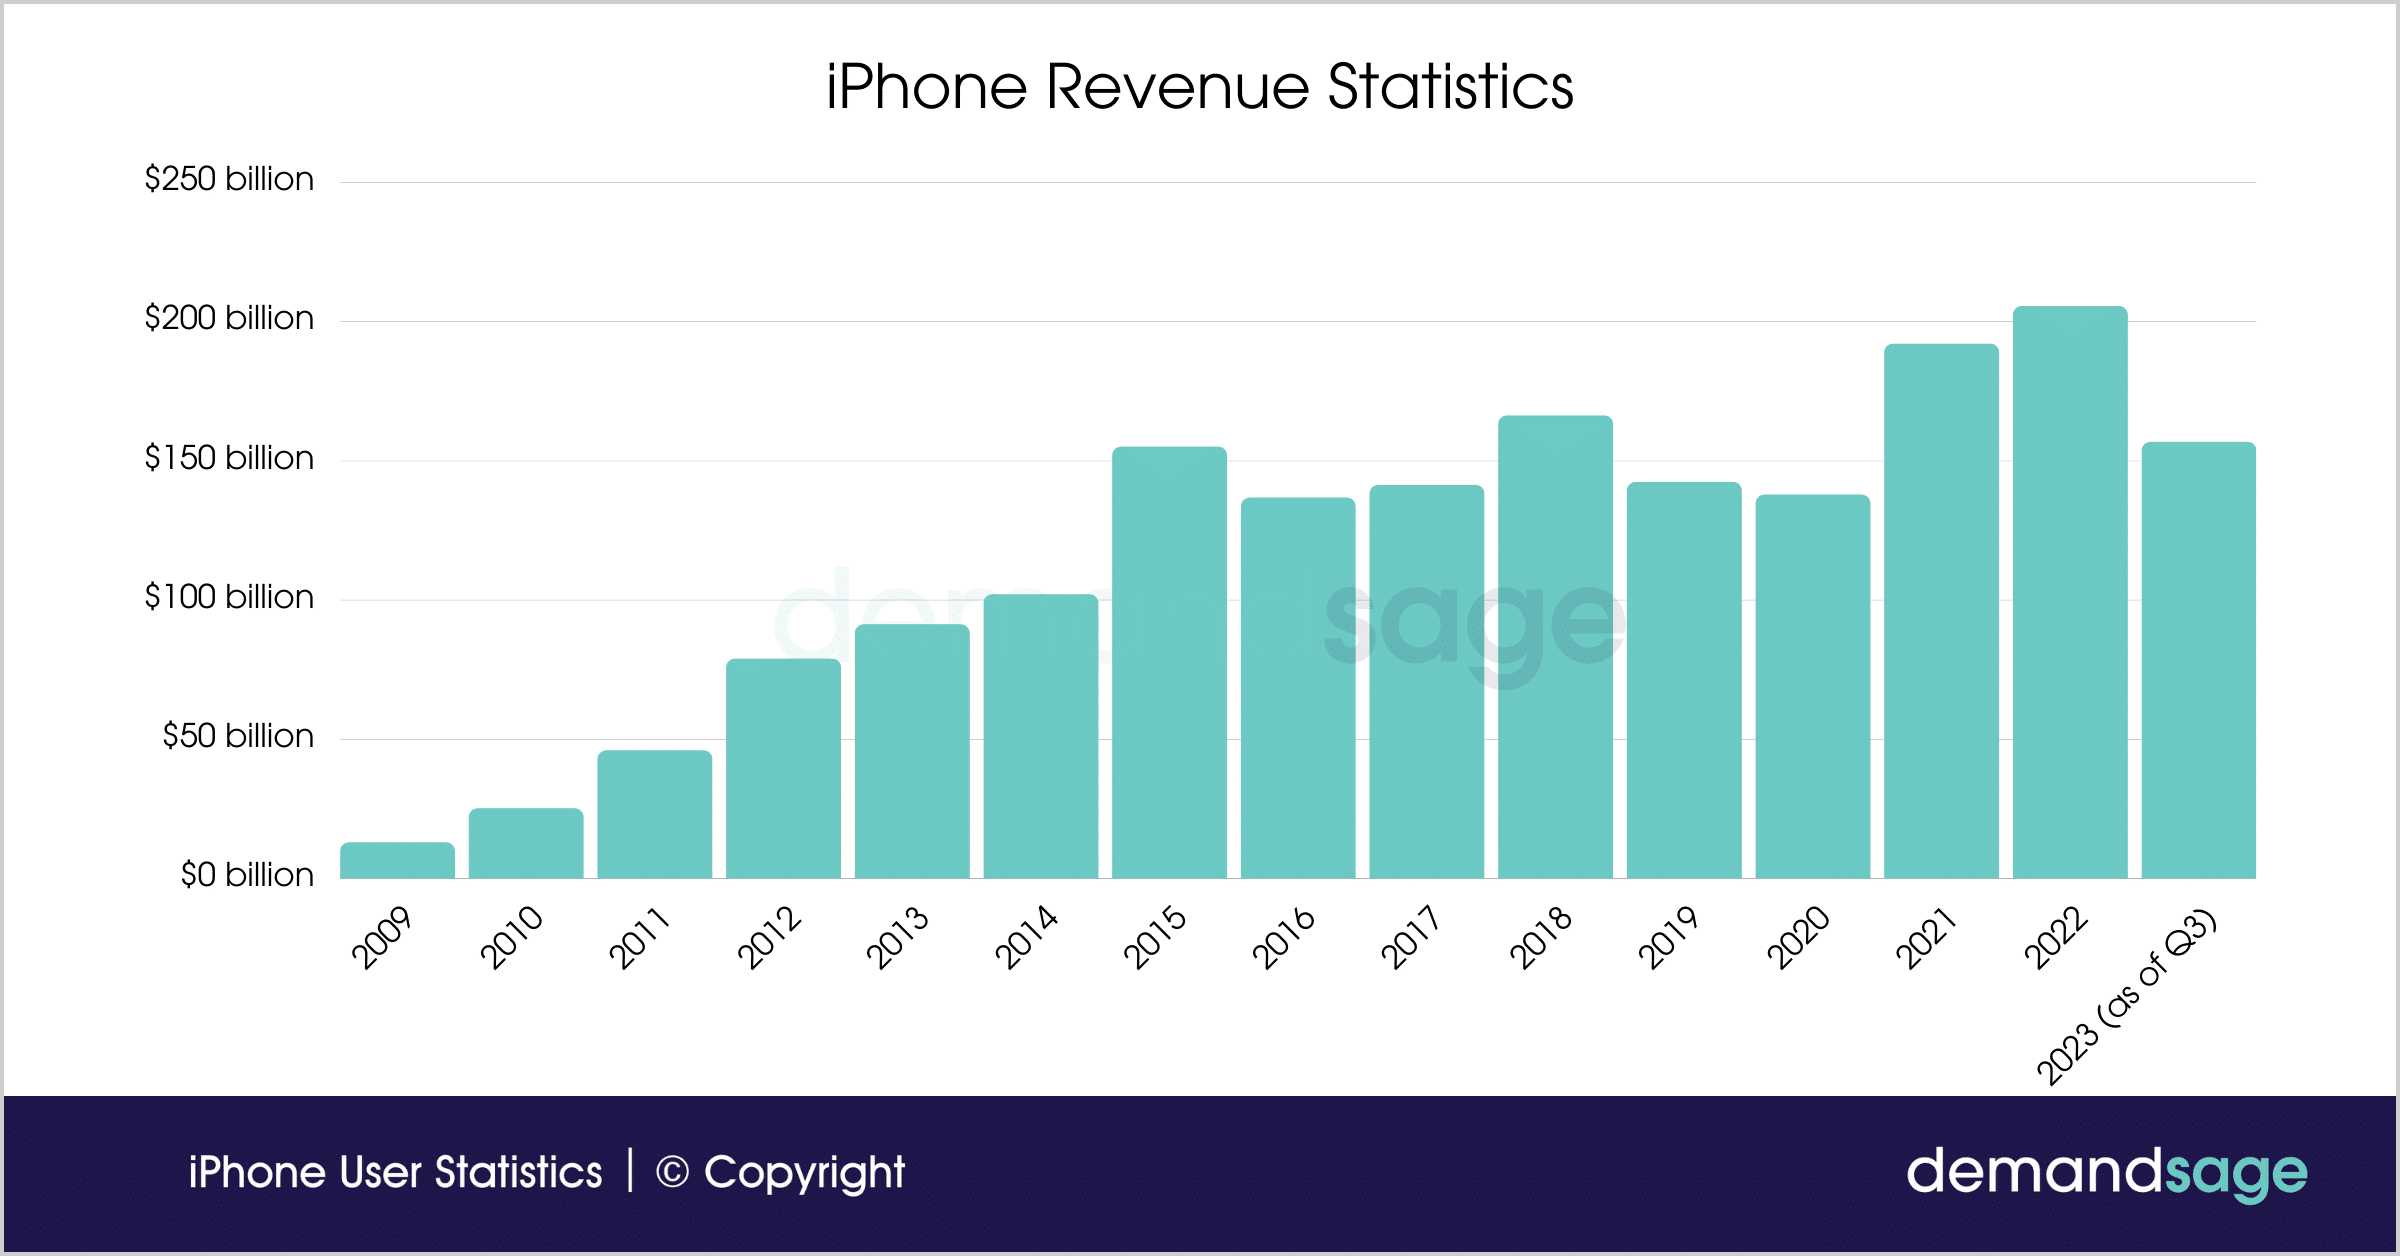
Let us take a close look at how much Apple is making by selling iPhones and how much it is contributing to its total revenue:
| Year | iPhone Revenue | Share in Apple’s Total Revenue |
|---|---|---|
| 2009 | $13.033 billion | 30.16% |
| 2010 | $25.179 billion | 38.31% |
| 2011 | $45.998 billion | 43.61% |
| 2012 | $78.962 billion | 51.14% |
| 2013 | $91.279 billion | 53.08% |
| 2014 | $101.99 billion | 56.19% |
| 2015 | $155.04 billion | 65.95% |
| 2016 | $136.7 billion | 62.48% |
| 2017 | $141.32 billion | 60.46% |
| 2018 | $166.27 billion | 61.80% |
| 2019 | $142.381 billion | 53.89% |
| 2020 | $137.78 billion | 48.95% |
| 2021 | $191.973 billion | 51.9% |
| 2022 | $205.49 billion | 51.52% |
| 2023 (as of Q3) | $156.78 billion | 53.36% |
Sage Note: The above quarters are for Fiscal Year 2023
iPhone 15 Statistics — Insights and News
The iPhone 15 arrived in the global market with a bang. Its demand is drawing large lines at Apple stores worldwide but especially in the US, China, India, and Europe.
Apple’s also experiences the highest sales in 2023 in the third quarter due to the flagship’s release.
Let us have a look at some exciting news on the newest iPhone yet!
iPhone 15’s demand is soaring in China
- The first couple of hours of the iPhone 15 launch saw a 253% uptick compared to last year, according to one of China’s biggest online retailers, JD.com.
JD.com is partnered with more than 4,000 Apple resellers in the country, so we know their data can be trusted.
iPhone 15 has gained exponential orders globally
- The iPhone 15 has had between 10% and 12% more pre-orders than the iPhone 14 so far.
It is predicted that the iPhone 15 Pro Max will be the most-sold iPhone
- The iPhone 15 Pro Max will make up most of the iPhone 15 series shipments in 2023, accounting for 35 to 40%. Shipments of the iPhone 15 Pro Max are expected to increase by around 10% compared to the iPhone 14 Pro Max.
The iPhone 14 Pro Max was the most sold smartphone in the world in the first half. This suggests that users like using a smartphone with a bigger screen!
Related Read:

