YouTube is the biggest video-sharing platform and the second-biggest social media in the world, with over 2.70 billion users as of 2024.
It is estimated that the number of YouTube’s global users will reach 2.85 billion by 2025.
If you are a creator or a marketer who wishes to know more about the platform, then you are at the right place. I have compiled a list of up-to-date and detailed statistics related to YouTube, which will help you gain insights and make informed decisions for your future ventures.
Youtube Statistics 2024 (Top Picks)
- YouTube has more than 2.70 billion active users in 2024.
- YouTube Premium has 80 million active users worldwide.
- 52% of internet users access YouTube at least once a month.
- YouTube gets around 113 billion visits each month.
- YouTube generated $22.31 billion via advertising in 2023.
- India is home to most YouTube users accounting for 467 million users. The USA follows with 247 million.
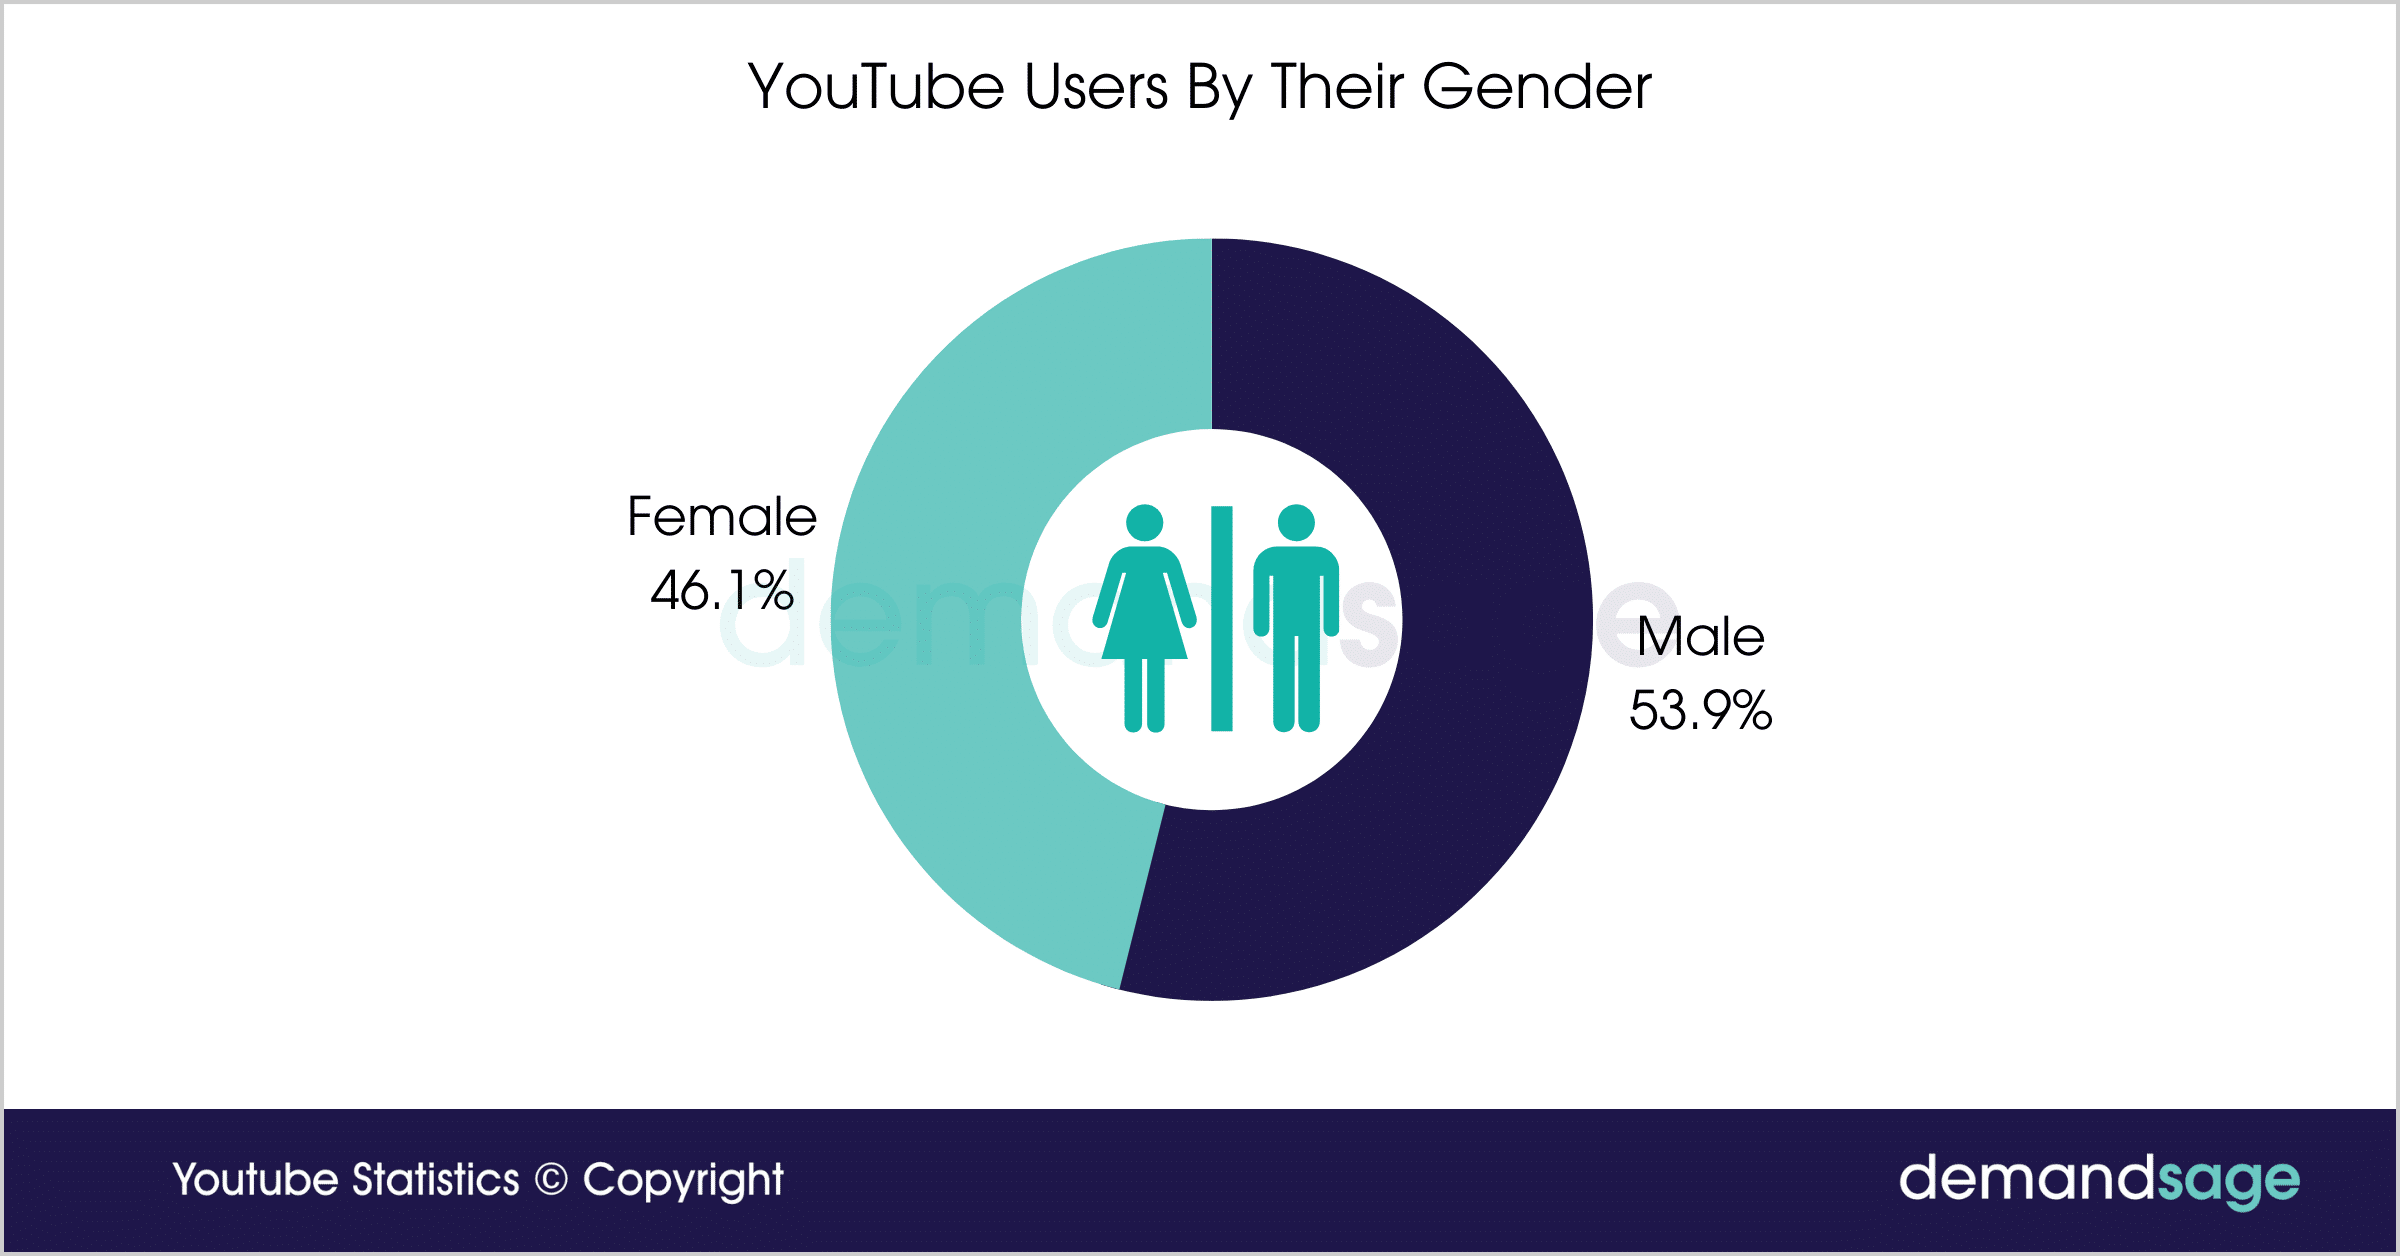
- 53.9% of YouTube users are Males, and Females make up around 46.1% of the user base.
- The majority of YouTube users are between the age of 25-34.
- 720,000 hours of video are uploaded to the platform daily.
- Users consume 1 billion hours of videos on YouTube every day.
YouTube Overview
Here is a quick overview of YouTube
| URL | https://www.youtube.com/ |
| Founded | 14th February 2005 (18 Years ago) |
| Headquarters | 901 Cherry AvenueSan Bruno, California, United States |
| Parent Company | Alphabet |
| Key People | Susan Wojcicki (CEO), Chad Hurley (Advisor), Sundar Pichai (Alphabet CEO) |
In-depth YouTube Statistics
Let me show you the more detailed side of YouTube in this section.
YouTube Monthly Active Users
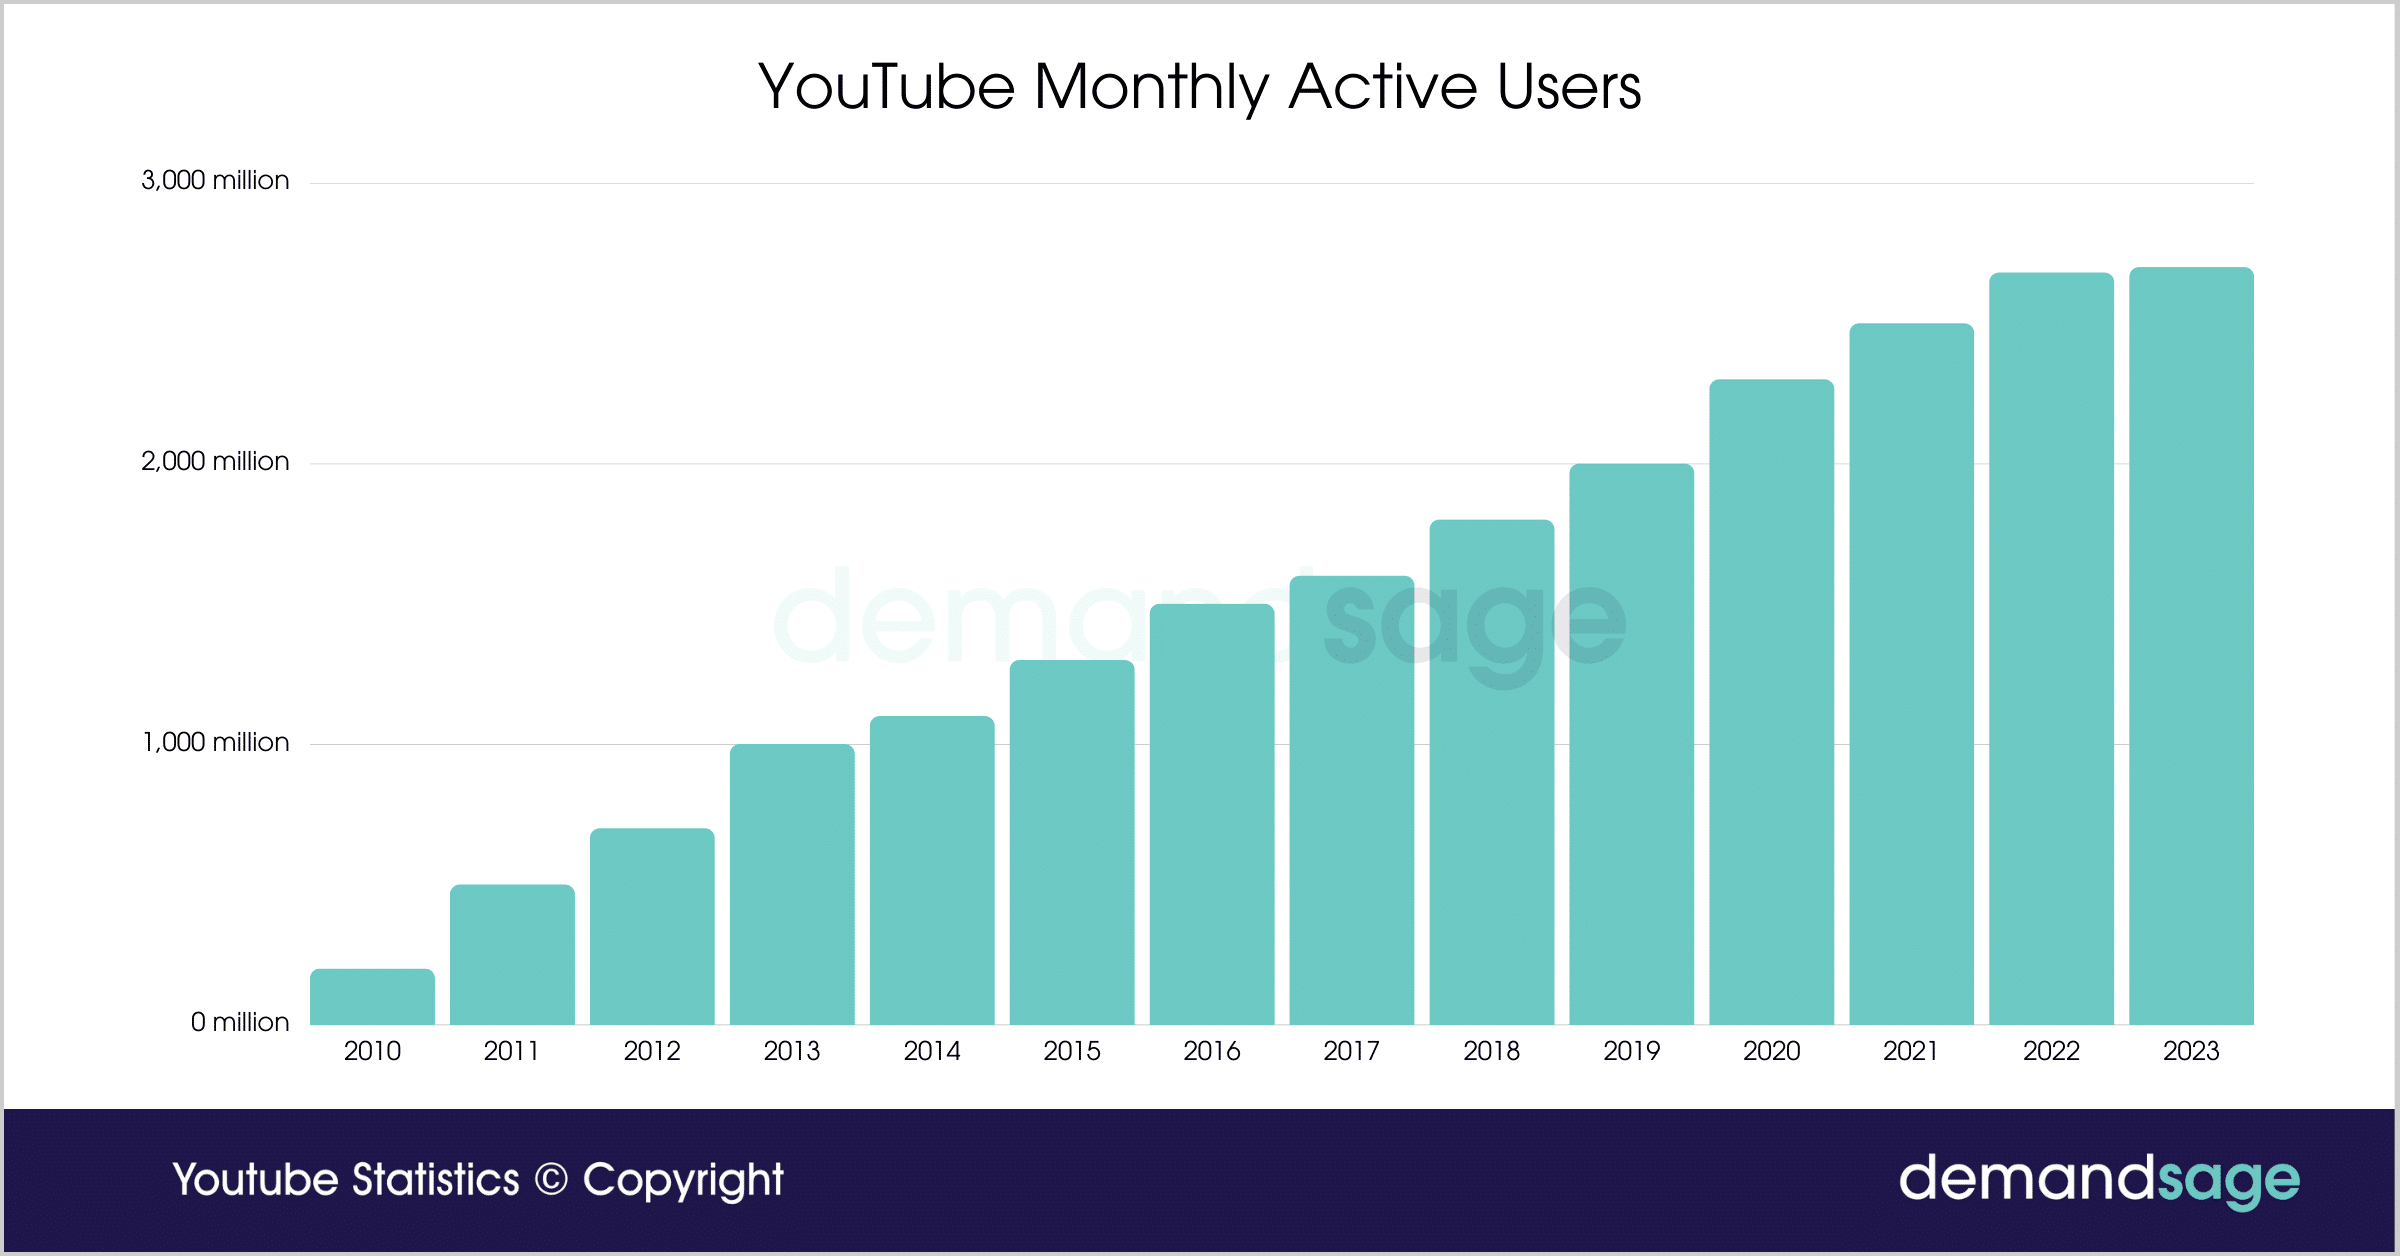
YouTube has over 2.70 billion monthly active users as of 2024, which means 51% of all internet users access the video-sharing platform every month.
- 33% of the world’s population uses YouTube every month.
- More than 50% of mobile internet users access YouTube every month.
Below is the table showing the growth in YouTube’s Monthly Active Users over the years:
| Year | YouTube Monthly Active Users |
|---|---|
| 2010 | 200 million |
| 2011 | 500 million |
| 2012 | 700 million |
| 2013 | 1 billion |
| 2014 | 1.1 billion |
| 2015 | 1.3 billion |
| 2016 | 1.5 billion |
| 2017 | 1.6 billion |
| 2018 | 1.8 billion |
| 2019 | 2 billion |
| 2020 | 2.3 billion |
| 2021 | 2.5 billion |
| 2022 | 2.68 billion |
| 2023 | 2.70 billion |
YouTube Daily Active Users
It is estimated that over 122 million people visit YouTube every day via its Website and Apps.
Sage’s Read: Recently we have done a detailed analysis of Youtube Creators. Read our YouTube Creator Statistics here.
- 62% of YouTube users in the U.S.A. access the platform daily. That is equivalent to 153.14 million people.
- Users consume 1 billion hours of videos on YouTube every day.
- Content worth 500 hours is uploaded on YouTube every day.
YouTube Premium Subscribers
YouTube Premium is the ad-free version of YouTube. You also get access to Youtube music when you purchase YouTube premium.
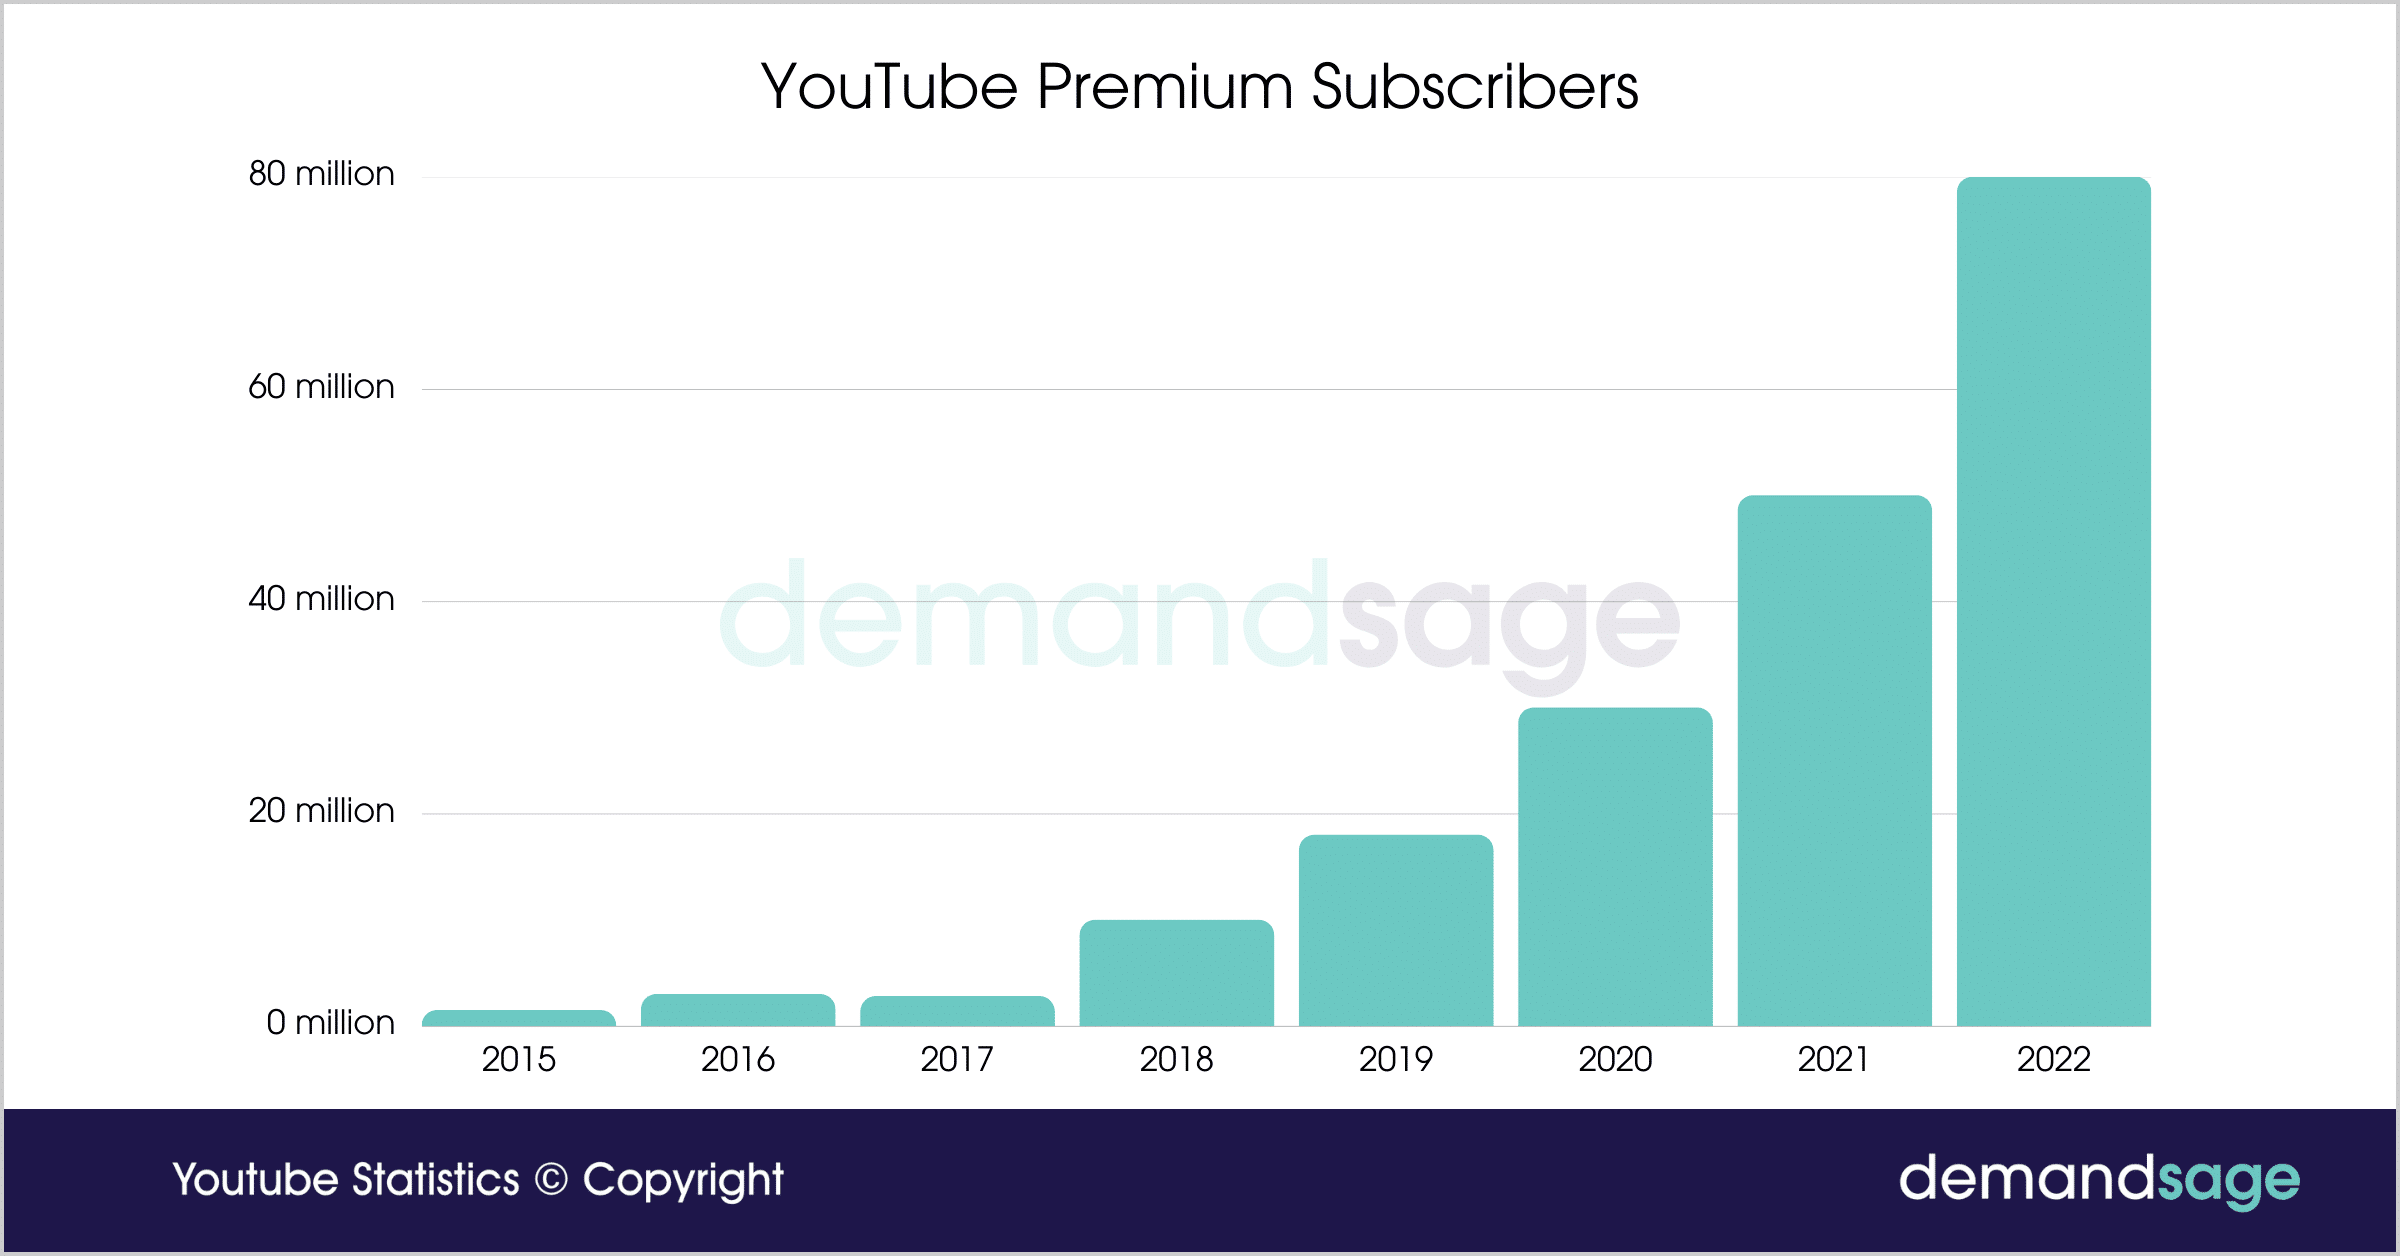
YouTube Red was rebranded as YouTube Premium in 2018. As of now, there are 80 million YouTube premium users globally.
Being Ad-free is not the only perk of YouTube Premium; it also lets you play videos in the background when you close the app.
Recently, YouTube ended the trial in which it was offering 4K videos to only the premium members. The Good news is that now 4K videos on the platform are not just exclusive to the premium members. Still, getting the premium plan is worth the money spent.
YouTube Music is another great addition to the package; I personally love YouTube Music’s audio output more than Spotify’s (talking about both on the highest Settings). Also, the autoplay suggestions are better than Spotify.
Here is the overview of YouTube Premium users as of 2022
| Year | Number Of Youtube Premium Subscribers |
|---|---|
| 2015 | 1.5 million |
| 2016 | 3 million |
| 2017 | 2.8 million |
| 2018 | 10 million |
| 2019 | 18 million |
| 2020 | 30 million |
| 2021 | 50 million |
| 2022 | 80 million |
YouTube Revenue Statistics
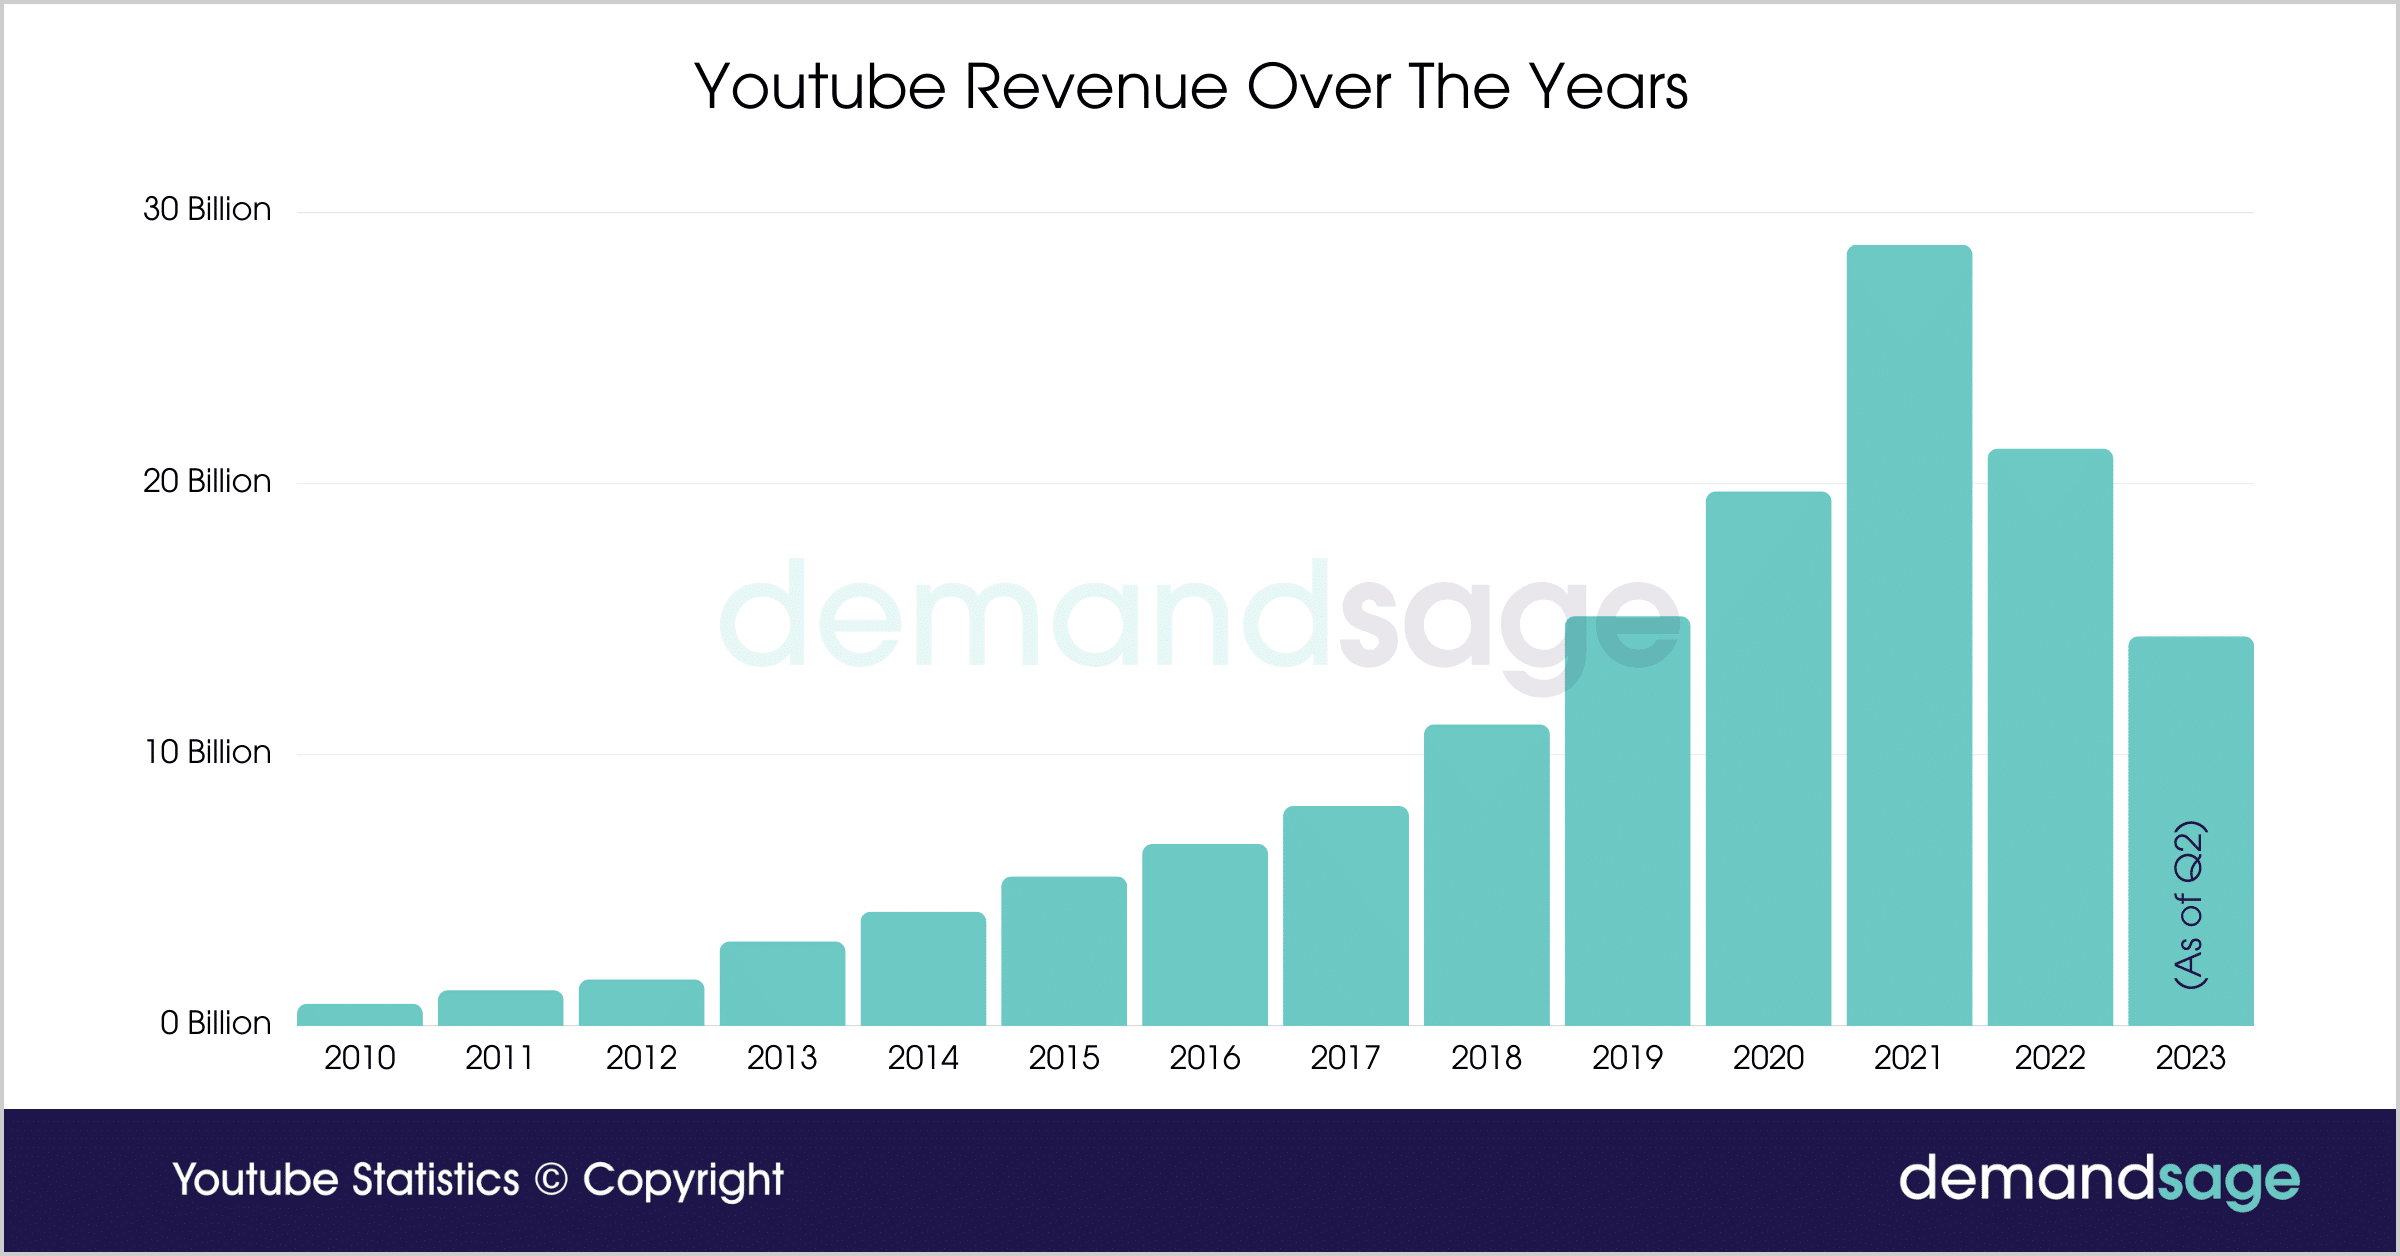
YouTube experienced over 30% growth in revenue in the past 4 years.
YouTube managed to register a revenue of $22.31 billion in revenue in the first three quarters of 2023
YouTube generated $29.24 billion in 2022, which is a 1.53% increase compared to 2021’s figures.
Here is the Overview of YouTube’s Yearly Revenue over the years:
| Year | Revenue |
| 2010 | $800 million |
| 2011 | $1.3 billion |
| 2012 | $1.7 billion |
| 2013 | $3.1 billion |
| 2014 | $4.2 billion |
| 2015 | $5.5 billion |
| 2016 | $6.7 billion |
| 2017 | $8.1 billion |
| 2018 | $11.1 billion |
| 2019 | $15.1 billion |
| 2020 | $19.7 billion |
| 2021 | $28.8 billion |
| 2022 | $29.24 billion |
| 2023 (As of Q3) | $22.31 billion |
Youtube IAP Revenue By Region
The United States ranked first in generating the most revenue from YouTube in-app purchases in June 2023. Users spent over $35 million on the platform via their mobile devices. Japan and South Korea follow the US with $20.31 million and $8.65 million in revenue, respectively
Here is a table showing countries with the most YouTube In-App Purchases:
| Country | Youtube IAP Revenue |
|---|---|
| United States | $35.3 million |
| Japan | $20.31 million |
| South Korea | $8.65 million |
| Ukraine | $5.16 million |
| Brazil | $2.93 million |
| Taiwan | $2.87 million |
| Australia | $2.76 million |
| United Kingdom | $2.45 million |
| Canada | $2.21 million |
| Hong Kong | $2.13 million |
YouTube Users by Country
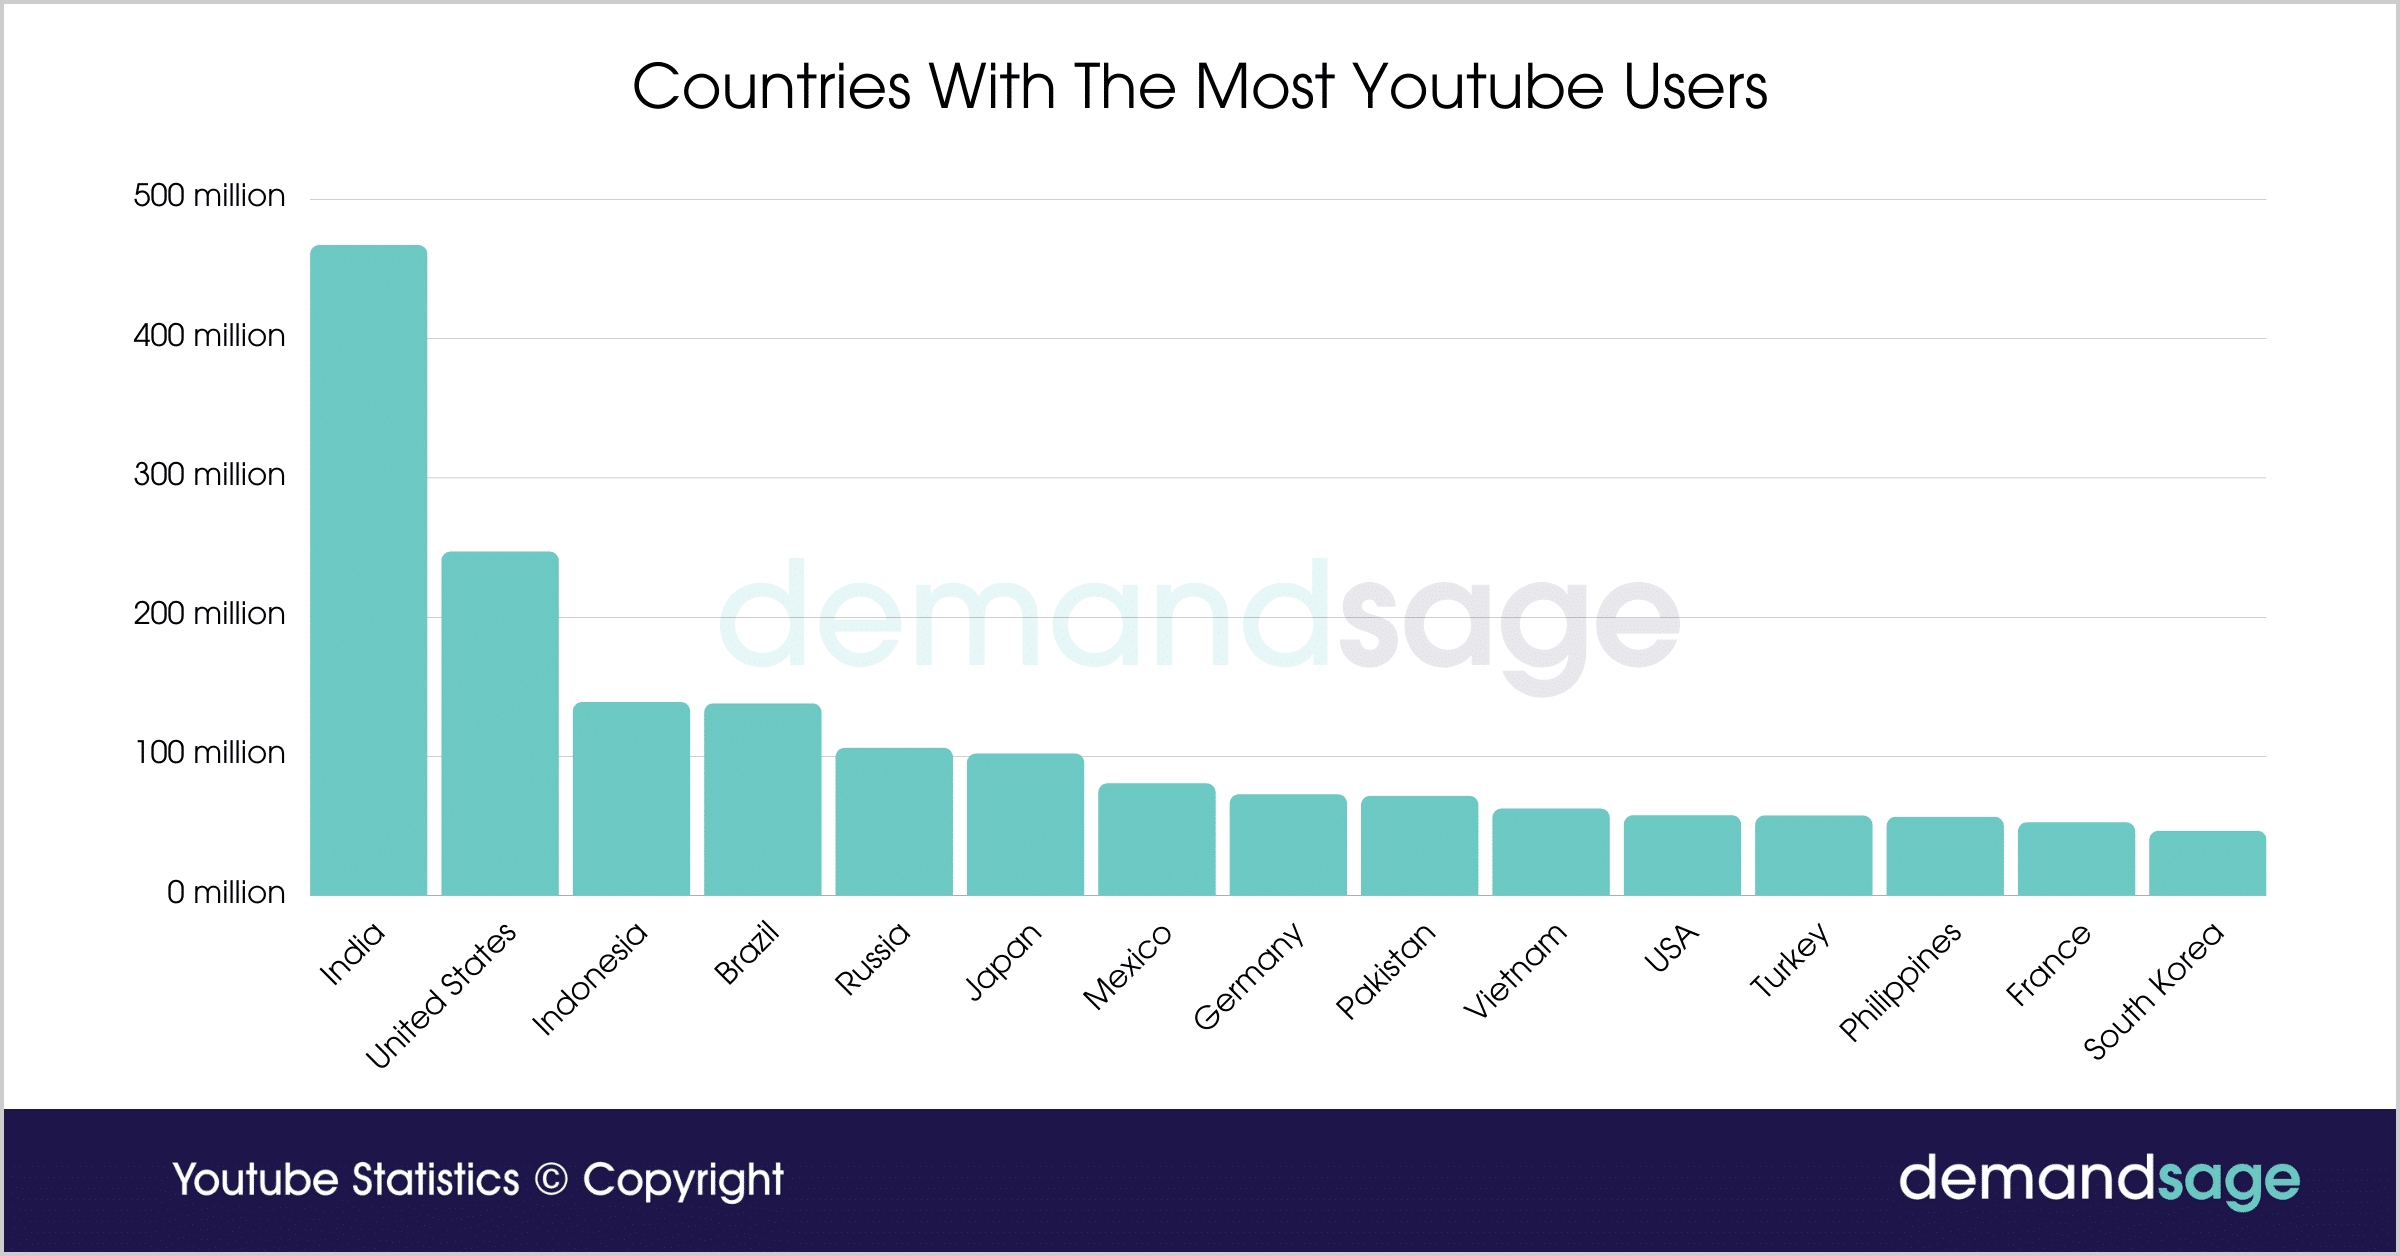
The majority of YouTube users come from India (467 million). That means 18.68% of YouTube users are from India.
The U.S.A. is the country with the second-most YouTube users (247 million).
Here is the breakdown of the Top 15 countries with the most YouTube users as of 2024:
| Country | Number of Users |
|---|---|
| India | 467 million |
| United States | 247 million |
| Indonesia | 139 million |
| Brazil | 138 million |
| Russia | 106 million |
| Japan | 102 million |
| Mexico | 80.6 million |
| Germany | 72.6 million |
| Pakistan | 71.7 million |
| Vietnam | 62.5 million |
| United Kingdom | 57.6 million |
| Turkey | 57.4 million |
| Philippines | 56.5 million |
| France | 52.6 million |
| South Korea | 46.4 million |
It is also important to note that YouTube is banned in 6 Countries.
Here is the list of the countries where YouTube is currently banned (2024).
- China (excluding Hong Kong and Macau)
- Eritrea
- Iran
- North Korea
- Turkmenistan
- South Sudan
Amid the Russia-Ukraine War, YouTube is still not banned in Russia.
YouTube’s Rank Among Social Media.
As of 2024, YouTube is the second biggest social media in the world, with over 2.7 billion active users.
Only Facebook (3.05 billion) has more active users than YouTube.
There are 4.95 billion active social media users worldwide. This means that 54% of active social media users in the world access YouTube.
Here is a list of the biggest social media platforms in the world.
| Social Media Platform | Number of Users |
|---|---|
| 3.05 billion | |
| 2.7 billion | |
| Youtube | 2.7 billion |
| 2.5 billion | |
| 1.67 billion | |
| TikTok | 1.67 billion |
| Facebook Messenger | 988 million |
| Snapchat | 750 million |
| Telegram | 700 million |
| Douyin | 600 million |
| 574 million | |
| Sina Weibo | 573 million |
| Kuaishou | 573 million |
| 450 million | |
| 450 million | |
| 430 million | |
| Quora | 400 million |
YouTube Usage Statistics
YouTube users consume 1 billion hours’ worth of video every day. This figure translates to approximately 5 billion videos every day.
- A typical user spends around 20 minutes and 23 seconds on Youtube.
- YouTube hosts more than 800 million videos on the platform.
- 500 hours of video is uploaded to YouTube every minute.
YouTube Usage Statistics by Device
87.7% of all YouTube views come from a mobile device. It is no wonder that YouTube’s Android app has more than 10 billion downloads to date.
YouTube also states that more than 450 million hours of content is viewed on Smart TVs.
Gender and Age of YouTube Users
- 53.9% of global YouTube users are Males. Females make up around 46.1% of the user base.
Here is the overview of YouTube Users by their gender
| Gender | Share of YouTube Users | Share In Number |
|---|---|---|
| Male | 53.9% | 1.38 billion |
| Female | 46.1% | 1.18 billion |
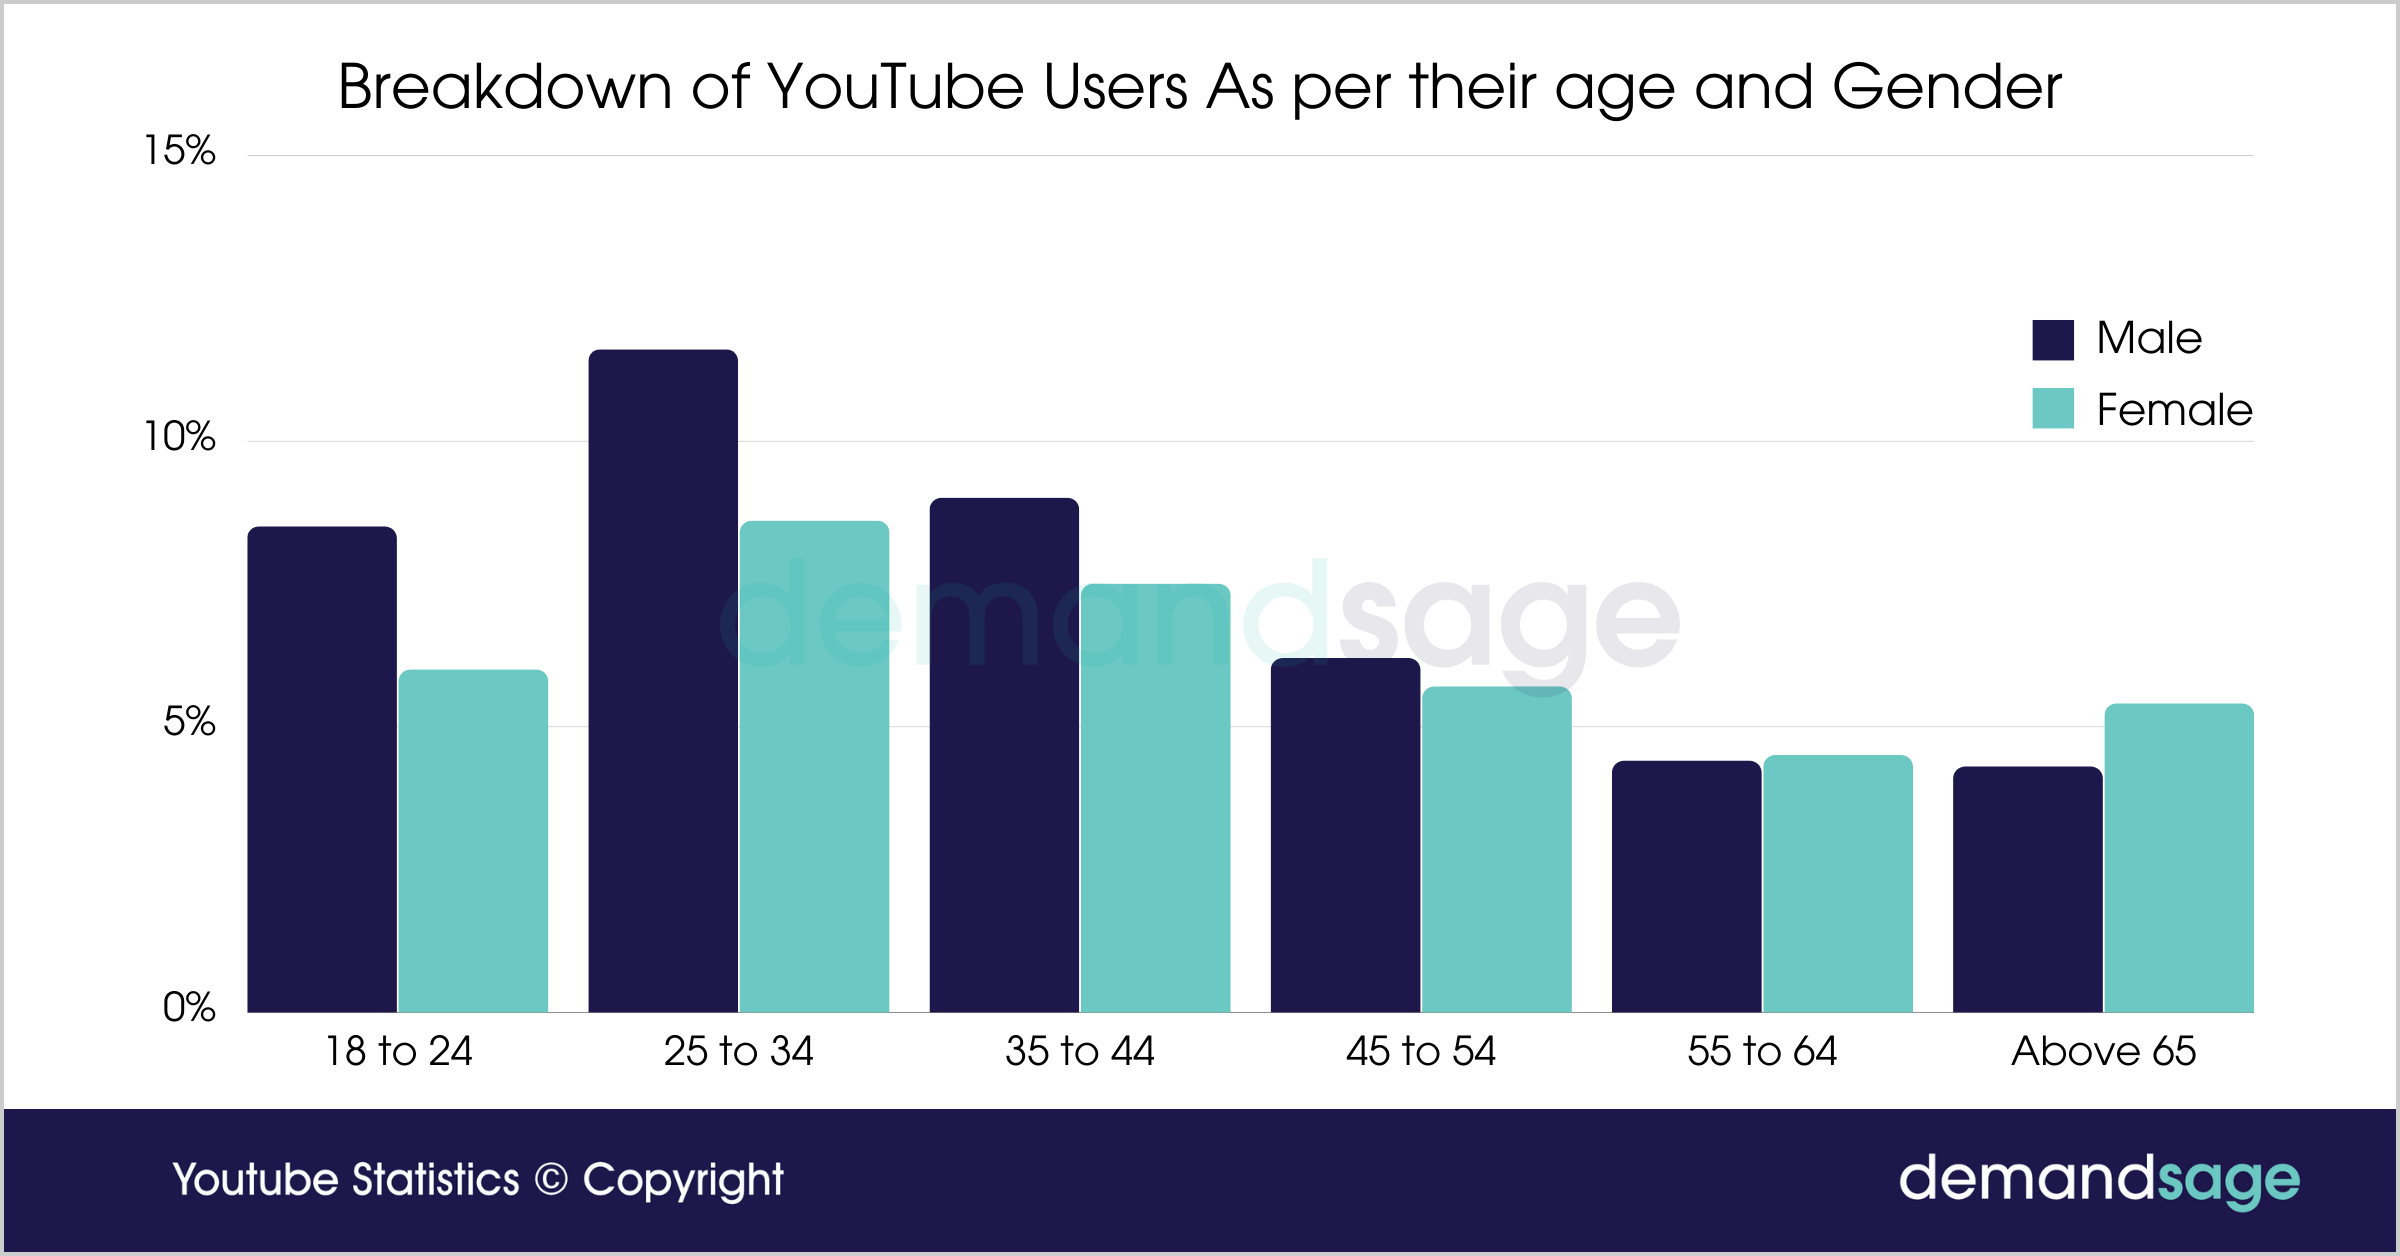
Below is the Breakdown of YouTube Users As per their age and gender:
| Age Group | Male | Female |
|---|---|---|
| 18 to 24 | 8.5% | 6% |
| 25 to 34 | 11.6% | 8.6% |
| 35 to 44 | 9% | 7.5% |
| 45 to 54 | 6.2% | 5.7% |
| 55 to 64 | 4.4% | 4.5% |
| Above 65 | 4.3% | 5.4% |
- The majority of global YouTube users are between the age of 25-34.
Here is the overview of global YouTube users as per their age
| Age Group | Share of Users |
|---|---|
| 18 to 24 | 14.5% |
| 25 to 34 | 20.2% |
| 35 to 44 | 16.5% |
| 45 to 54 | 11.9% |
| 55 to 64 | 8.9% |
| Above 65 | 9.7% |
YouTube Penetration Statistics
The Netherlands is the country with the most YouTube penetration as of 2024.
YouTube’s penetration rate in the Netherlands is 94.9%.
Although India and the United States are the top two countries with the most YouTube users, they don’t even make it to the top 20 in Penetration rate.
India’s Penetration rate of YouTube is 37%, while the U.S.A. has a 79.3% penetration rate.
YouTube’s Worldwide penetration rate is 37.6%.
Here is the overview of YouTube’s Penetration Rate:
| Country | YouTube Penetration Rate |
|---|---|
| Netherlands | 94.9% |
| South Korea | 94% |
| New Zealand | 93.8% |
| Sweden | 93.7% |
| U.A.E. | 93.2% |
| United Kingdom | 92.1% |
| Denmark | 91.9% |
| Switzerland | 91.8% |
| Canada | 91.7% |
| Spain | 91.6% |
| Germany | 91.5% |
| Hong Kong | 91.3% |
| Israel | 91% |
| Saudi Arabia | 90.5% |
| Australia | 89.1% |
| Belgium | 88.6% |
| France | 88.2% |
| Ireland | 88% |
| Singapore | 87.8% |
| Taiwan | 87.3% |
YouTube Shorts Statistics
YouTube launched YouTube Shorts, a competition to Tik Tok in September 2020.
YouTube shorts was first launched in India. It was later rolled out for the U.S.A and 26 other nations. Currently, YouTube shorts are available in more than 100 nations.
- YouTube Shorts surpassed 50 billion daily views in February 2023.
Here is a table showing the daily views in June 2021 and February 2023:
| Time | Views |
|---|---|
| June 2021 | 30 billion |
| February 2023 | 50 billion |
- During the launch in India, the maximum time period to record a short was 15 seconds. Later, when it was launched in the USA and other countries, the time was lengthened to 60 seconds.
- 72% of YouTube Shorts are more than 15 seconds long.
- In the second quarter of 2021, YouTube announced a $100 million fund for YouTube Shorts which ran until 2022.
YouTube Channel Statistics
As of 2024, YouTube has over 51 million Channels.
T-series, an Indian music record label, is the most followed YouTube channel with 217 million subscribers.
PewDiePie is the individual YouTuber with the most subscribers. He has 111 million YouTube subscribers.
SET India is the most subscribed channel in the entertainment category with 133 million subscribers.
Blackpink, a K-pop girls group, is the most followed music artist channel with 74.2 million subscribers.
Here is an overview of the most followed YouTube Channels as of 2024:
| Channel | Link to their YouTube Channel | Subscribers |
| T-Series | YouTube Channel Link | 257 million |
| MrBeast | YouTube Channel Link | 229 million |
| Cocomelon Nursery Rhymes | YouTube Channel Link | 170 million |
| SET India | YouTube Channel Link | 167 million |
| Kids Diana Show | YouTube Channel Link | 118 million |
| Like Nastya | YouTube Channel Link | 112 million |
| PewDiePie | YouTube Channel Link | 111 million |
| Vlad and Niki | YouTube Channel Link | 108 million |
| Zee Music Company | YouTube Channel Link | 103 million |
| W.W.E. | YouTube Channel Link | 98.9 million |
YouTubers With the Most Revenue
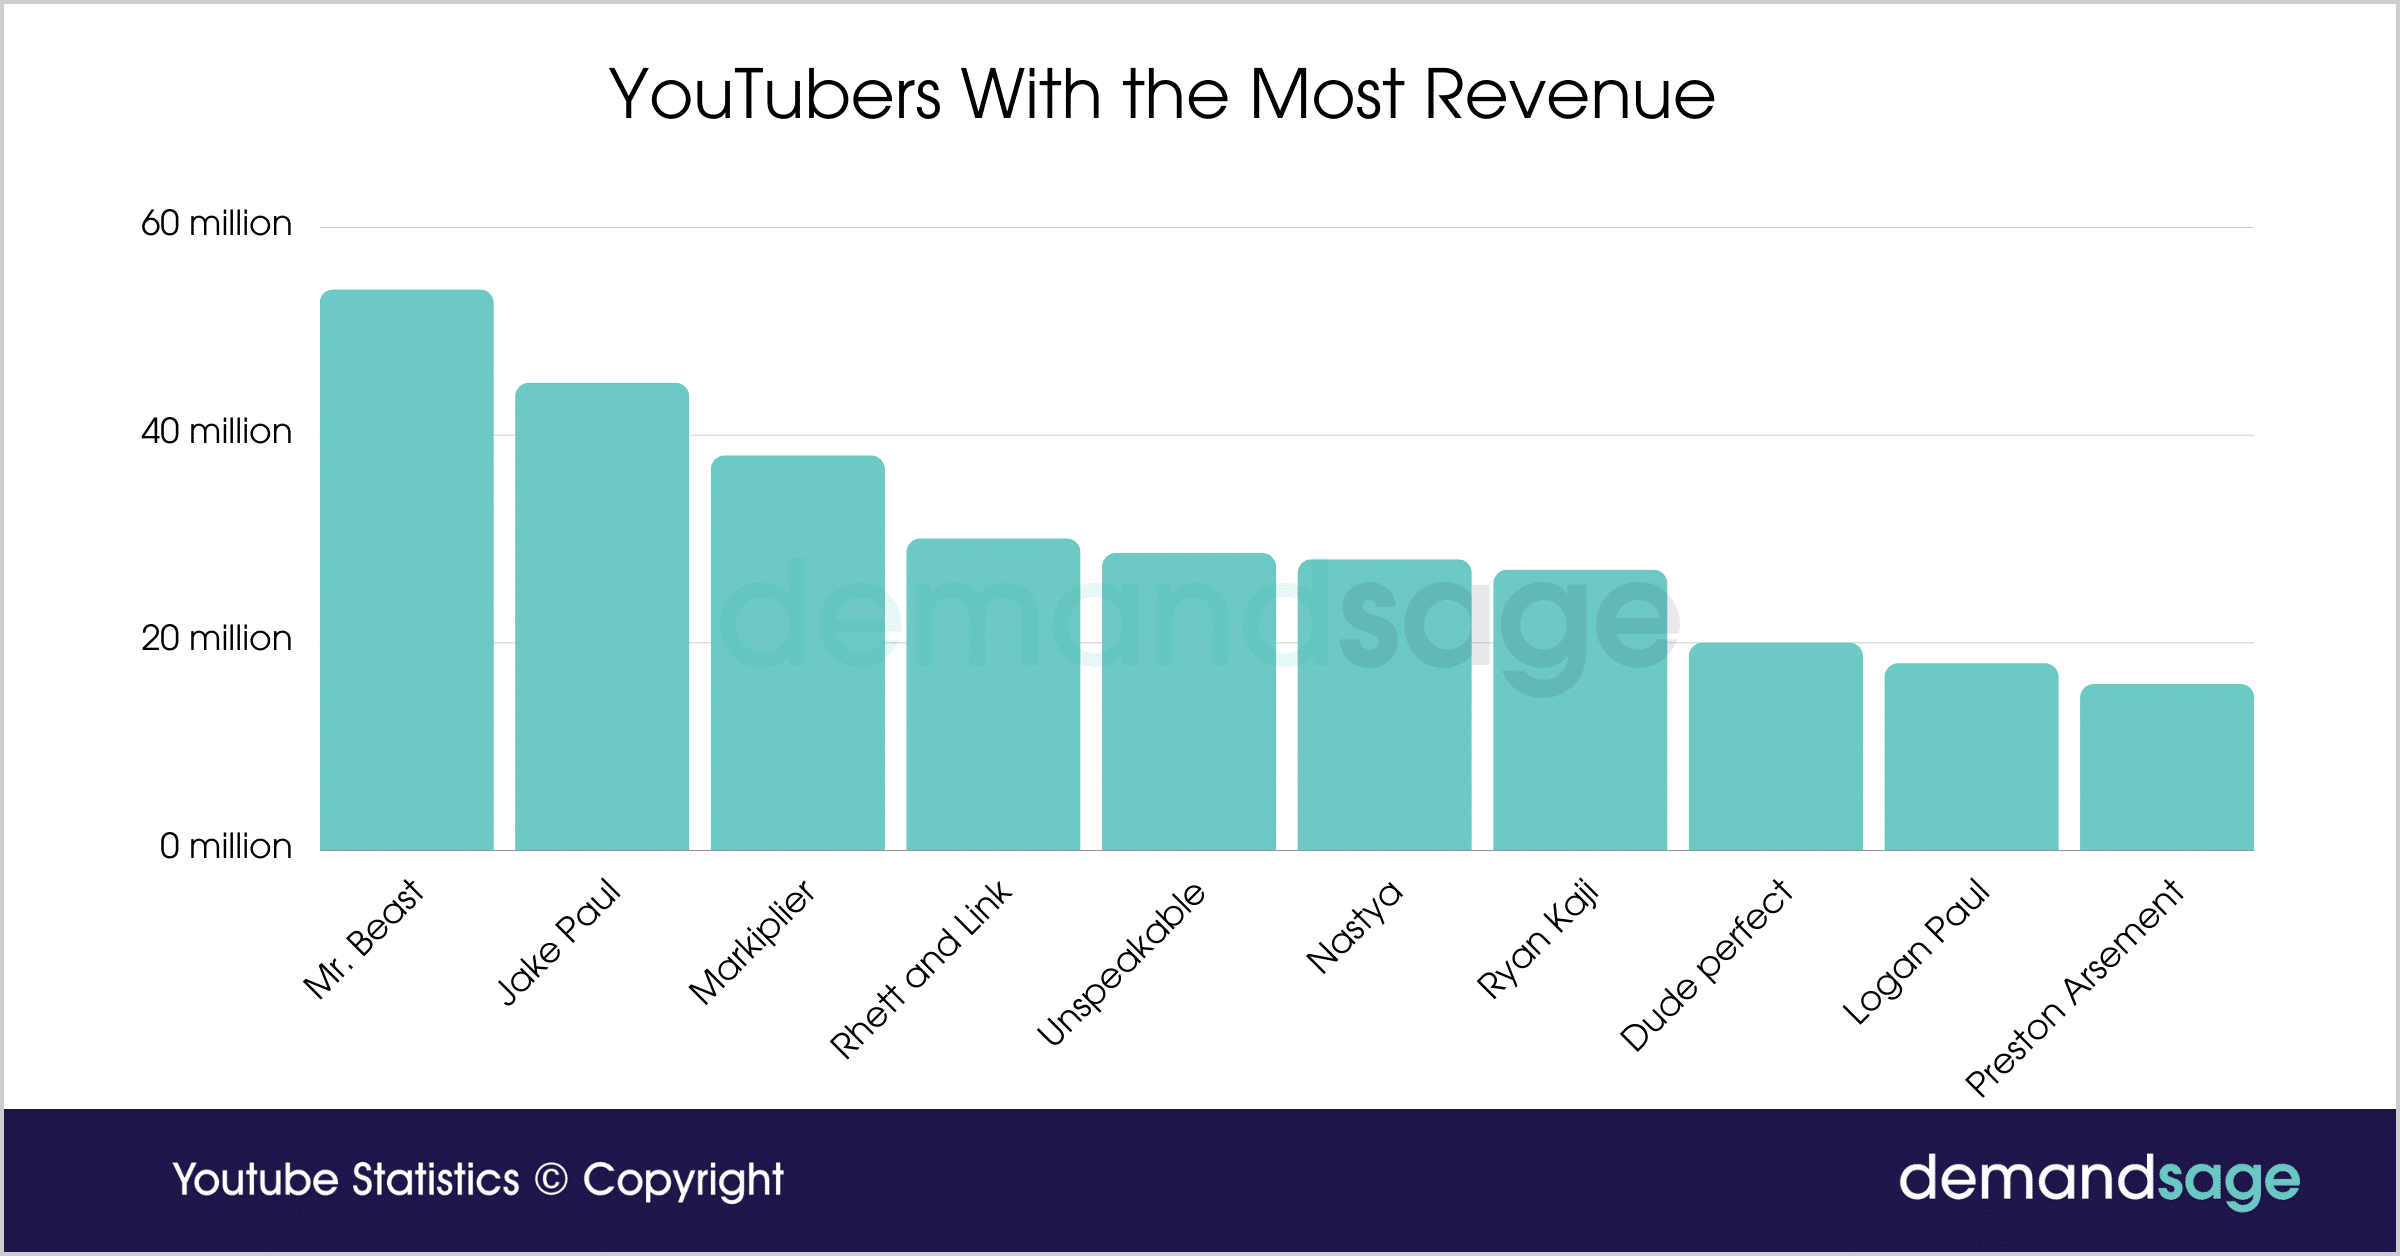
Mr. Beast is the highest-earning YouTuber as of 2024. Last year, he earned around $54 million through YouTube.
Here is the overview of YouTubers with the most revenue:
| YouTuber | Revenue |
| Mr. Beast | $54 million |
| Jake Paul | $45 million |
| Markiplier | $38 million |
| Rhett and Link | $30 million |
| Unspeakable | $28.6 million |
| Nastya | $28 million |
| Ryan Kaji | $27 million |
| Dude Perfect | $20 million |
| Logan Paul | $18 million |
| Preston Arsement | $16 million |
Additional YouTube Facts and Insights
In this section, we will go through some important data associated with YouTube in a quick manner!
Only 9% of Small Businesses In The United States Use YouTube
That means only 2.98 million businesses out of the 33.2 million use YouTube for their video marketing strategy. If you are a small business owner or a marketer who caters to small businesses, you should tap this untapped vast market to gain an edge over your competition.
In current times, it has become easier than ever to produce videos with generative AI.
Around 30% of Youtubers face difficulties in locating and engaging their desired audience
These problems include identifying the ideal time to post on the platform, doing YouTube SEO, finding relevant hashtags, and more.
Bonus: We have done the math for you! You can check out the best time to post on YouTube by going through our comprehensive guide.
Around 34% of videos removed from YouTube are deleted due to child safety reasons
An additional 5% of flagged videos were taken down because they were spam or had content that was misleading. Around 8% of the removed videos were deleted because they contained cyberbullying and harassment.
Here is a table showing the top reasons for the removal of YouTube videos:
| Reason For Removal | Share of Flagged Videos |
|---|---|
| Child Safety | 34% |
| Harmful Or Dangerous | 17.1% |
| Violent or Graphic | 16.4% |
| Budity or Sexual | 12.1% |
| Harassment and Cyberbullying | 8.3% |
| Spam, Misleading and Scams | 4.6% |
| Hateful or Abusive | 3.8% |
| Promotion of Violence and Violence Extremism | 1.3% |
| Other | 0.5% |
66% of people say their YouTube usage will increase in the future
Around 66% of respondents in a Statista survey said that their YouTube usage will increase in the future while 19% said their usage will stay the same. 1% said it will remain the same.
Related Read:
